
SLIDE 1
AirCore: The gold standard for evaluation of satellite retrievals
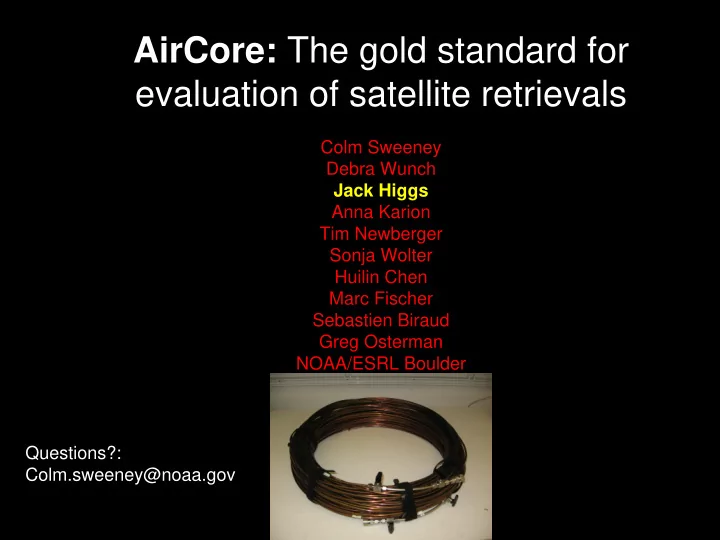
Colm Sweeney Debra Wunch Jack Higgs Anna Karion Tim Newberger Sonja Wolter Huilin Chen Marc Fischer Sebastien Biraud Greg Osterman NOAA/ESRL Boulder Questions?: Colm.sweeney@noaa.gov