
SLIDE 1
- A. R. Ingraffea, PhD, PE
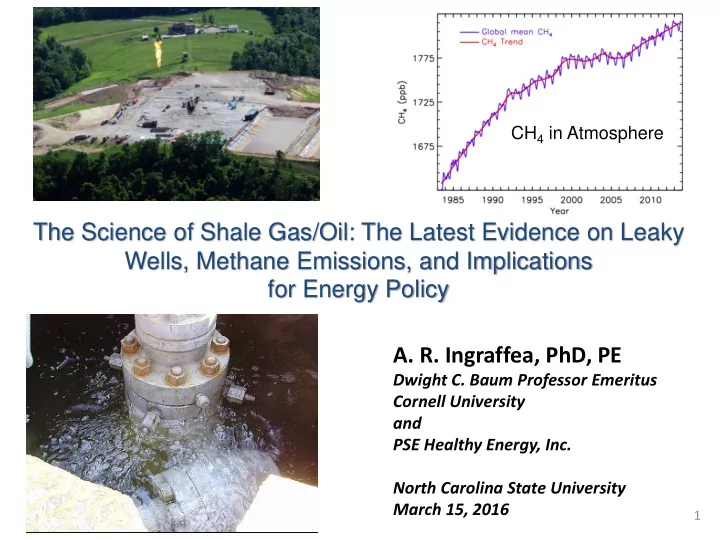
Dwight C. Baum Professor Emeritus Cornell University and PSE Healthy Energy, Inc. North Carolina State University March 15, 2016
1
CH4 in Atmosphere
A. R. Ingraffea, PhD, PE Dwight C. Baum Professor Emeritus Cornell - - PowerPoint PPT Presentation
CH 4 in Atmosphere The Science of Shale Gas/Oil: The Latest Evidence on Leaky Wells, Methane Emissions, and Implications for Energy Policy A. R. Ingraffea, PhD, PE Dwight C. Baum Professor Emeritus Cornell University and PSE Healthy Energy,
Dwight C. Baum Professor Emeritus Cornell University and PSE Healthy Energy, Inc. North Carolina State University March 15, 2016
1
CH4 in Atmosphere
2
3
Raleigh Chapel Hill Durham
The New Frontier: North Carolina Shale, Emily Moser, Hart Energy Friday, March 27, 2015
““This is just an opportunity for North Carolina to get into the game of energy development and to do it in a safe and responsible way,” said David McGowan, North Carolina Petroleum Council (NCPC) executive director.”
4
“We really won’t know the extent of the interest and potential development possibilities here until some of that exploratory work is conducted,” he said. The sub-basin represents a small fraction of the total Triassic Basin formations in the state — about 59,000 acres out of a total of 785,000 acres. At 160-acre spacing, 368 wells could be drilling the Sanford, for a volume of technically recoverable gas of 309 billion cubic feet (Bcf) of gas, according to the DENR.”
5
FS 2012-3075 (U.S. Geological Survey fact sheet, June 2012)
6
From Southwestern Energy (SWN) Investors Report, July 2015 https://www.swn.com/investors/LIP/latestinvestorpresentation.pdf Only ~10% is being recovered 15 Bcf @ $1.50 per mcf is $17.5 million gross at the wellhead. But, need 6-8 wells per section to get it out, @ ~ $5 million drilling cost each…. Only ~10% is being recovered 0.34 Bcf @ $1.02 per mcf is $350,000 gross at the wellhead. But, need 6-8 wells per section to get it out, @ ~ $5 million drilling cost each….
7
8
9
10
SCALE 10 miles
11
12
Multi-well pad and pits Washington County, PA 650 feet Yeager Pit, Washington County, PA Flaring during flowback Washington County, PA
13
Photos Courtesy of Bob Donnan Early Design: 2010 Compressor Transmission Station : 2013
14
15
16
17
Howarth, Ingraffea, NATURE, 477, 2011
7.9% 3.6%
18
19
20
Methane Bubbling At Well Head
.
22
“There were numerous studies on fugitive emissions of
looked at and decided was not as credible as…well we didn’t think it was credible, I’ll just put it that way and it was over estimating fugitive emissions.”
Former U.S. Energy Secretary and Nobel Prize Winner Steven Chu while giving a speech at America’s Natural Gas Alliance “Think About Energy Summit”, Columbus, Ohio
23
Range Predicted by Howarth et al., 2011
Remote sensing of fugitive methane emissions from oil and gas production in North American tight geologic formations, Schneising et al., 2014, EARTH’S FUTURE, doi: 10.1111/eft2 2014EF000265
24
25
26
OBAMA ADMINISTRATION EXPANDS CLIMATE FIGHT—The Washington Post’s Joby Warrick: “The Obama administration took a step Friday toward plugging thousands of small methane leaks from oil and gas operations around the country, saying the escaping gas is contributing to climate change. The Interior Department announced proposed regulations that would require energy companies to reduce methane leaks in order to drill anywhere on land owned by the government or Native American tribes. The proposals would affect more than 100,000 oil wells that supply about 10 percent of the nation’s natural gas.” http://wapo.st/1NtPG8x
27
A large increase in US methane emissions over the past decade inferred from satellite data and surface observations Turner et al., 2016, AGU, doi: 10.1002/2016GL067987
“Here we use satellite retrievals and surface observations of atmospheric methane to suggest that US methane emissions have increased by more than 30% over the 2002-2014 period. This large increase in US methane emissions could account for 30-60% of the global growth of atmospheric methane seen in the past decade.”
28
courtesy of Ed Dlugokencky, NOAA
29
“Today, as part of the Obama Administration’s ongoing commitment to act on climate, President Barack Obama and Canadian Prime Minister Justin Trudeau committed to new actions to reduce methane pollution from the oil and natural gas sector, the world’s largest industrial source of methane. These actions build on the historic agreement that nearly 200 nations made in Paris last December to combat climate change and ensure a more stable environment for future generations.”
WASHINGTON (AP) — The leaders of the United States and Canada committed on Thursday to curbing methane emissions by undertaking regulations that would target oil and gas production.
30
Associated Press March 10, 2016 By KEVIN FREKING, Associated Press
31
Shindell, et al. Science 335, 183 (2012);
32
33
34
Our New Zero-Energy Home… In UPSTATE NY Community Solar Farm… In UPSTATE NY
35
36
37
38
http://thesolutionsproject.org/infographic/#nc
39
40
41
42
43
44
Over 50% published since Jan 1, 2014 727 publications now in database
45
https://www.zotero.org/groups/pse_study_citation_database/items
46
https://www.zotero.org/groups/pse_study_citation_database/items
47
48
49
50
51
“If gas were truly used as a very temporary bridge to replace coal … But that’s not what’s happening. If you build a new power plant, you don’t plan to shut it down in 10 years. There’s way too much gas in the ground. It would put us way over 2C, 3C, 4C. There’s a huge amount of gas in the ground. What political leaders have not been willing to do is face the truth that you can’t burn all of that. They’re allowing, even bragging about, having found the technology to get more of the gas out of the ground with fracking.”
52
I am a civil engineer. Civil engineers know bridges. A bridge has an abutment at one end, where you are. A bridge has another abutment at the
The bridge spans over that danger into which you do not want to fall. The so-called shale gas/oil bridge is the only one ever conceived where the bridge is constructed of the danger into which you do not want to fall.
53
54
LONDON – The world’s biggest oil companies are slashing jobs and backing off major investments as the price of crude falls to new lows – and there may be more pain to come. Companies like BP, which said Tuesday it is cutting 4,000 jobs, are slimming down to cope with the slump in oil, whose price plummeted to its lowest level in 12 years and is not expected to recover significantly for months, possibly years. California-based Chevron said last fall it would eliminate 7,000 jobs, while rival Shell announced 6,500 layoffs… some 95,000 jobs were lost in the energy sector by U.S.- based companies in 2015, according to the consulting firm Challenger, Gray &
http://www.observer reporter.com/20160112/as_oil_plunges_energy_companies_cut_jobs_postpone_projects_
“After cutting 20,000 jobs this year, Schlumberger warns of new layoff round…”
http://petroglobalnews.com/2015/12/schlumberger-warns-of-new-layoff-round/
http://oilprice.com/Energy/Energy-General/Oil-Jobs-Lost-250000-And-Counting-Texas-Likely-To-See-Massive-Layoffs- Soon.html
Brufatto et al., Oilfield Review, Schlumberger, Autumn, 2003
SCP=Sustained Casing Pressure. Also called sustained annular pressure, in one or more of the casing annuli.
55
From George E King Consulting Inc.: http://gekengineering.com/id6.html
56
57
58
Cumulative Indicator Count Cumulative Spuds Inspected % Wells with Indicator Conventional 280 26,915 1.00% Unconventional 355 5,763 6.20% Statewide Total 635 32,678 1.90%
While the overall impairment rate inferred from inspection records is < 2%, unconventional wells show a much higher rate of 6.2%, heavily influenced by impairments in the NE region, which are ~5x higher than rest
http://powersource.post-gazette.com/powersource/policy-powersource/2014/07/19/Corbett-administration-agrees-to-halt-new-natural- gas-leases-under-state-parks-and-forests/stories/201407190031
“Oil and gas operations have damaged Pennsylvania water supplies 209 times since the end of 2007”
1000 2000 3000 4000 5000 6000 10 20 30 40 50 2006 2008 2010 2012 2014 DEP Determinations Spuds 59
“Pennsylvania regulators found an array
private water supplies they said were damaged by oil and gas operations during the past seven years.”
60
FRESH WATER AQUIFER ZONE SHALLOW PRODUCING ZONE INTERMEDIATE PRODUCING ZONE CONDUCTOR PIPE SURFACE CASING PRODUCTION CASING
TARGET PRODUCING ZONE
61
PRESSURE BUILDS UP
CONDUCTOR PIPE SURFACE CASING PRODUCTION CASING FRESH WATER AQUIFER ZONE SHALLOW PRODUCING ZONE INTERMEDIATE PRODUCING ZONE TARGET PRODUCING ZONE CASING CEMENT FORMATION
62
CONDUCTOR PIPE SURFACE CASING PRODUCTION CASING FORMATION CASING FRESH WATER AQUIFER ZONE SHALLOW PRODUCING ZONE INTERMEDIATE PRODUCING ZONE TARGET PRODUCING ZONE
PRESSURE BUILDS UP 63
PRESSURE BUILDS UP
CONDUCTOR PIPE SURFACE CASING PRODUCTION CASING FRESH WATER AQUIFER ZONE SHALLOW PRODUCING ZONE INTERMEDIATE PRODUCING ZONE TARGET PRODUCING ZONE
64
66
4 in.
67
Photos courtesy of Robert Donnan
68