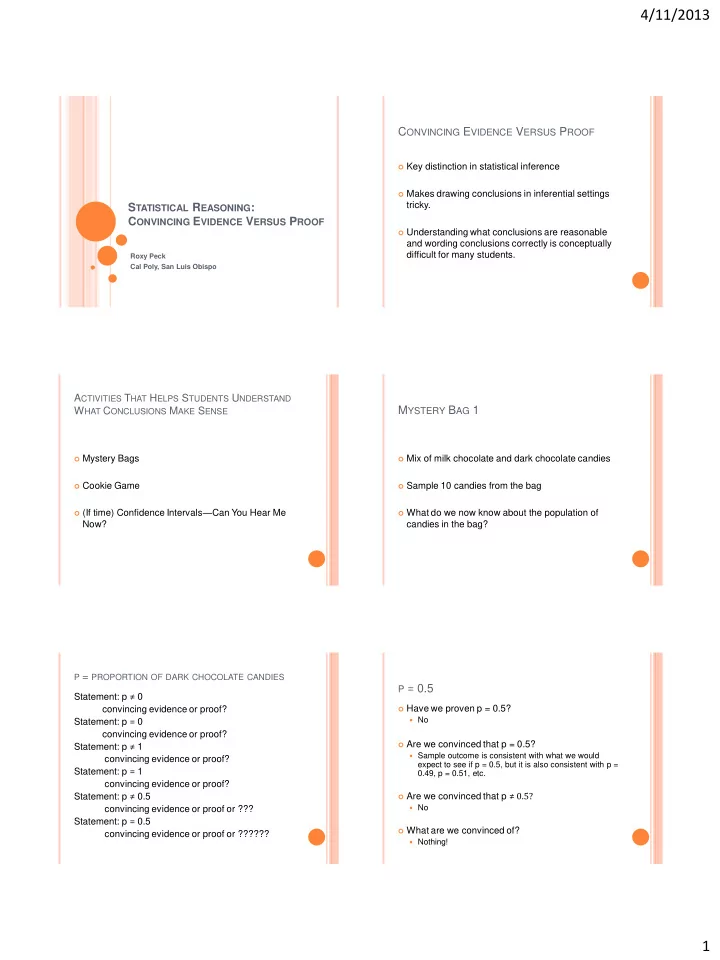

4/11/2013 C ONVINCING E VIDENCE V ERSUS P ROOF Key distinction in statistical inference Makes drawing conclusions in inferential settings tricky. S TATISTICAL R EASONING : C ONVINCING E VIDENCE V ERSUS P ROOF Understanding what conclusions are reasonable and wording conclusions correctly is conceptually difficult for many students. Roxy Peck Cal Poly, San Luis Obispo A CTIVITIES T HAT H ELPS S TUDENTS U NDERSTAND M YSTERY B AG 1 W HAT C ONCLUSIONS M AKE S ENSE Mystery Bags Mix of milk chocolate and dark chocolate candies Cookie Game Sample 10 candies from the bag (If time) Confidence Intervals — Can You Hear Me What do we now know about the population of Now? candies in the bag? P = PROPORTION OF DARK CHOCOLATE CANDIES P = 0.5 Statement: p ≠ 0 convincing evidence or proof? Have we proven p = 0.5? Statement: p = 0 No convincing evidence or proof? Statement: p ≠ 1 Are we convinced that p = 0.5? Sample outcome is consistent with what we would convincing evidence or proof? expect to see if p = 0.5, but it is also consistent with p = Statement: p = 1 0.49, p = 0.51, etc. convincing evidence or proof? Statement: p ≠ 0.5 Are we convinced that p ≠ 0.5? convincing evidence or proof or ??? No Statement: p = 0.5 What are we convinced of? convincing evidence or proof or ?????? Nothing! 1
4/11/2013 M YSTERY B AG 2 A HIERARCHY . Have we proven p = 0.5? Proof No Have we proven p ≠ 0.5? Convincing evidence (that a claim is false) No Are we convinced that p ≠ 0.5? No convincing evidence that a claim is false. Yes The conclusion that is NOT possible based on a Difference between convincing evidence and proof sample (except in really rare cases of claims about proportions being 0 or 1): Convincing evidence that a claim is true. U NDERSTANDING C ONVINCING E VIDENCE -- T HE L OGIC OF H YPOTHESIS T ESTING D ISCUSSION P OINTS Cookie Game illustrate all elements of a statistical hypothesis test Competing claims about a population, one of The Cookie Game which is initially assumed to be true (the null hypothesis) Observation Assessment of how likely observed outcome would be if the null hypothesis is true A decision based on whether the observed outcome would have been likely or unlikely to occur when the null hypothesis is true AMATYC November 2008 I MPORTANT THAT STUDENTS UNDERSTAND … D ISCUSSION P OINTS Convincing evidence vs. proof Possible conclusions in a hypothesis test are Convincing evidence against the null hypothesis 1. What if saw 2 of 5? Would this be proof that the true proportion is 0.5? Convincing evidence?? No convincing evidence against the null 2. hypothesis Relationship between probability assessment and AND choice of significance level No convincing evidence against the null hypothesis IS NOT THE SAME AS Convincing evidence that the null hypothesis is true AMATYC November 2008 2
4/11/2013 A ND W HILE W E A RE ON THE S UBJECT OF D IFFICULT I NTERPRETATIONS N ORMAL P OPULATION WITH MEAN µ 10 random samples of size 25. Pick a sample and Interpreting confidence level… calculate a 90% confidence interval for µ. Sample Sample mean Sample standard deviation 1 101.67 9.58 2 98.51 9.40 “Can you hear me now?” activity. 3 96.45 8.59 4 100.14 6.53 5 98.20 11.52 6 102.87 9.39 7 100.83 8.86 8 100.07 9.67 9 102.13 9.01 10 102.31 11.06 N ORMAL P OPULATION WITH MEAN µ M EANING OF 90% C ONFIDENCE Common student error (maybe even more common 10 samples of size 25 than a correct answer!): The probability that the population mean is in my interval is 0.9. Sample 90% confidence interval for µ Ask students what a probability of 0.9 means. The 1 (98.396, 104.953) get to the 90% of the time, in the long run, … 2 (95.296, 101.728) 3 (93.516, 99.393) Then play the “Can you hear me now?” game. 4 (97.906, 102.372) Actual population mean is 100. Is it in your interval. 5 (94.259, 102.146) How about now? 6 (99.658, 106.081) How about now? 7 (98.486, 103.181) How about now? 8 (96.761, 103.382) This interpretation of confidence level doesn’t make 9 (99.052, 105.215) sense because NOTHING is random here! 10 (98.523, 106.091) THANKS! Thanks for attending this session. Copies of Powerpoint slides are on the NCTM conference web site, or you can email me for a copy. Questions and Comments? rpeck@calpoly.edu 3
Recommend
More recommend