3 forms of convexity in graphs & networks
Lovro ˇ Subelj
University of Ljubljana Faculty of Computer and Information Science joint work with
Tilen Marc
University of Ljubljana Institute of Mathematics, Physics and Mechanics
COSTNET ’17
3 forms of convexity in graphs & networks joint work with Lovro - - PowerPoint PPT Presentation
3 forms of convexity in graphs & networks joint work with Lovro Subelj Tilen Marc University of Ljubljana University of Ljubljana Faculty of Computer and Institute of Mathematics, Information Science Physics and Mechanics COSTNET
Lovro ˇ Subelj
University of Ljubljana Faculty of Computer and Information Science joint work with
Tilen Marc
University of Ljubljana Institute of Mathematics, Physics and Mechanics
COSTNET ’17
f(x) f(x)
ℝ2
x1 x2 x1 x2
x x
disconnected ⊇ connected ⊇ induced ⊇ isometric ⊇ convex subgraphs
1/14
— S = {random node i} — until S contains n nodes:
∈ S by random edge
t = 0 t = 1 t = 2 tree-like clique-like
S quantifies (locally) tree-like/clique-like structure of graphs
2/14
s(t) = (t + 1)/n in convex & s(t) ≫ (t + 1)/n in non-convex graphs
5 10 15 0.2 0.4 0.6 0.8 1
Random tree
% nodes s(t) # steps t
random node central node
5 10 15 0.2 0.4 0.6 0.8 1
Triangular lattice
% nodes s(t) # steps t
random node central node
5 10 15 0.2 0.4 0.6 0.8 1
Random graph
% nodes s(t) # steps t
random node central node
7 2 6 9 13 10 11 15 8 12 1 14 3 5 4 11 8 8 8 13 11 4 3 1 6 13 11 5 3 2 9 13 15 11 7 7 7 9 10 15 12 12 12 12 12 15 14 14 14 14 3 3 3 3 3 3 3 3 3 3 3 3 3 1 3 3 3 3 3 4 3 3 3 3 3 3 3 3 3 3 3 3 3 3 3 3 3 3 3 3 5 3 3 3 2 3 3 3 3 3 3 3 3 3 3 8 7 11 3 3 3 3 3 3 3 3 3 3 3 3 3 2 3 3 3 3 3 3 3 3 3 3 3 2 3 3 3 3 3 3 3 3 3 3 3 3 3 3 3 3 3 3 3 3 3 3 3 3 3 3 3 3 3 3 3 3 3 3 3 3 3 3 3 9 3 3 3 3 3 10 3 3 3 3 3 3 3 3 3 3 3 3 3 3 3 3 3 3 3 3 6 3 3 3 3 3 3 3 3 3 3 3 3 3 3 3 3 3s(t) quantifies (locally) tree-like/clique-like structure of graphs
3/14
5 10 15 0.2 0.4 0.6 0.8 1
Western US power grid
% nodes s(t) # steps t
5 10 15 0.2 0.4 0.6 0.8 1
European highways
% nodes s(t) # steps t
5 10 15 0.2 0.4 0.6 0.8 1
US airports connections
% nodes s(t) # steps t
5 10 15 0.2 0.4 0.6 0.8 1
Networks coauthorships
% nodes s(t) # steps t
network edge rewiring Erdos−Renyi
5 10 15 0.2 0.4 0.6 0.8 1
Little Rock food web
% nodes s(t) # steps t
network edge rewiring Erdos−Renyi
5 10 15 0.2 0.4 0.6 0.8 1
Oregon Internet map
% nodes s(t) # steps t
random graphs fail to reproduce convexity in empirical networks random graphs convex for < O(ln n) & non-convex for > O(ln2 n) core-periphery networks have convex periphery & non-convex c-core
4/14
Xc = 1 −
n−1
c
Xc ≥ X RW
c
≥ X ER
c
Xc highlights tree-like/clique-like networks (cliques connected tree-like)
X1 X RW
1
X ER
1
X1.1 X RW
1.1
X ER
1.1
Western US power grid∗ 0.95 0.32 0.24 0.91 0.10 0.01 European highways∗ 0.66 0.23 0.27 0.44 −0.02 0.06 Networks coauthorships 0.91 0.09 0.06 0.83 −0.05 −0.09 Oregon Internet map 0.68 0.36 0.06 0.53 0.20 −0.09 Caenorhabditis elegans 0.57 0.54 0.07 0.43 0.40 −0.13 US airports connections 0.43 0.24 0.00 0.30 0.16 −0.07 Scientometrics citations 0.24 0.16 0.02 0.04 0.00 −0.13 US election weblogs 0.17 0.12 0.00 0.06 0.04 −0.08 Little Rock food web 0.03 0.03 0.02 −0.06 −0.02 −0.02
Xc measures global & regional (periphery) convexity in networks
5/14
Lc = 1 + max{ t | s(t) < (t + c + 1)/n } L1 ≤ LER
1
≈ ln n/ ln k Lc highlights locally tree-like/clique-like networks & random graphs
Lt LER
t
L1 LER
1
ln n/ ln k Western US power grid 14 9 6 9 8.66 European highways 16 7 7 7 7.54 Networks coauthorships 17 4 7 4 3.77 Oregon Internet map 3 4 3 4 4.40 Caenorhabditis elegans 2 5 2 5 5.79 US airports connections 2 3 2 3 2.38 Scientometrics citations 3 4 3 4 4.30 US election weblogs 2 2 2 2 2.15 Little Rock food web 2 2 2 2 1.59
Lc measures local & absolute (tree/clique) convexity in networks
6/14
tree/clique-like networks
5 5 5 5 5 5 5 5 5 5 5 5 31 5 5 60 5 5 5 5 18 5 5 5 8 5 35 5 77 5 5 5 5 5 5 5 5 5 15 5 5 5 5 5 5 55 5 5 5 5 5 19 5 64 8 5 5 5 5 5 5 5 5 5 84 68 5 5 35 89 89 89 60 5 83 5 5 5 5 5 9 5 5 81 15 5 29 5 5 5 5 5 5 5 5 5 5 5 5 5 5 5 5 5 5 5 5 5 5 5 5 5 18 13 5 34 8 7 49 5 20 45 48 5 98 74 71 5 5 5 5 5 5 5 5 5 5 42 5 5 14 46 5 2 5 5 8 5 85 5 5 5 5 61 75 16 51 44 56 21 78 65 66 27 43 62 96 38 54 99 5 5 4 33 39 5 5 87 5 5 28 32 3 5 36 1 52 80 5 6 22 17 73 5 5 5 5 5 30 5 5 5 58 5 5 5 5 5 5 5 8 5 5 5 5 8 72 77 5 5 63 5 76 5 5 86 39 47 5 5 5 5 5 5 82 5 5 5 5 5 5 55 5 5 93 5 5 5 58 5 5 69 5 11 5 88 5 28 8 8 5 5 5 8 5 5 8 5 5 5 5 30 40 30 30 5 5 5 5 95 5 5 5 5 5 5 5 77 73 5 5 87 26 5 41 50 58 5 5 5 5 5 8 5 5 5 70 5 59 8 5 5 5 5 40 5 5 5 25 23 23 86 5 8 8 58 5 46 53 13 5 8 5 5 94 12 37 79 91 92 97 90 5 67 24 5 5 57 10core-periphery networks etc.
6 6 6 6 13 6 6 6 6 6 6 6 6 6 6 6 6 6 6 6 6 6 6 6 6 6 6 6 6 14 6 6 6 6 6 6 6 6 6 6 6 6 6 6 6 6 6 6 6 6 3 6 6 6 6 6 6 6 6 6 6 6 6 6 6 6 6 6 6 6 6 6 6 6 6 6 6 6 6 6 6 6 6 6 6 6 6 6 6 7 6 6 4 6 6 6 6 6 6 6 6 6 6 6 6 6 6 6 6 6 6 6 6 6 6 6 6 6 6 6 6 6 6 6 6 6 6 6 6 6 6 6 6 6 6 6 6 6 6 6 6 6 6 6 6 6 6 6 6 6 6 6 6 24 6 6 6 6 6 6 6 10 6 6 6 6 6 6 22 6 6 6 6 6 6 6 6 6 6 6 6 6 6 6 6 6 6 6 6 6 6 6 6 6 6 6 6 6 6 12 6 6 6 6 6 6 6 6 6 6 6 6 6 6 6 6 6 6 6 17 6 6 6 6 6 6 6 16 6 6 6 6 6 6 6 6 6 6 6 6 6 6 6 6 6 6 6 6 6 6 6 6 6 6 6 6 6 6 6 6 6 6 6 6 6 11 6 6 6 6 6 6 6 6 6 6 6 6 6 6 6 6 6 6 6 6 6 6 1 6 6 6 6 6 6 6 6 6 6 6 6 6 6 6 6 6 6 6 6 6 6 6 6 6 6 6 6 6 6 6 6 6 6 6 6 21 6 6 6 6 6 6 6 6 6 6 6 6 6 6 6 6 6 15 6 6 6 6 6 6 6 6 6 6 6 6 6 6 6 6 6 6 6 6 6 8 6 6 6 6 6 6 6 6 6 6 6 6 6 6 6 6 6 6 6 6 6 6 6 20 6 9 6 6 6 6 6 6 23 6 6 6 6 6 6 6 6 6 6 6 6 6 6 6 25 6 6 6 6 6 6 6 6 6 6 6 6 6 6 6 6 6 6 6 6 6 6 6 6 6 18 6 6 6 6 6 5 6 6 6 6 6 6 6 6 6 2 6 6 6 6 6 6 6 6 6 6 6 6 6 6 6 6 6 6 6 6 6 6 6 6 6 6 19 6 6 6 6 6 6 6 6 6 6 6 6 6random graphs
< ln n/ ln k
robustness, navigation, optimization, abstraction, comparison etc.
7/14
Marc & ˇ Subelj (2017) Convexity in complex networks, Network Science, pp. 27
Tilen Marc
University of Ljubljana tilen.marc@imfm.si http://www.imfm.si
Lovro ˇ Subelj
University of Ljubljana lovro.subelj@fri.uni-lj.si http://lovro.lpt.fri.uni-lj.si
Lovro ˇ Subelj
University of Ljubljana Faculty of Computer and Information Science
COSTNET ’17
Xs = s −
sn−1
c
s = fraction of nodes in LCC Xs under degree-preserving/full randomization by edge rewiring Xs very sensitive to random perturbations of network structure
8/14
convex skeleton = largest high-Xs subnetwork (every S is convex) spanning tree & convex skeleton of network scientists coauthorships convex skeleton is tree of cliques extracted by targeted edge removal
9/14
C = 1 n
2ti ki(ki − 1) σ = 2 n(n − 1)
σij Xs = . . .
statistics of convex skeletons & spanning trees of networks
clustering C geodesics σ convexity Xs N CS ST N CS ST N CS ST Jazz musicians 0.62 0.81 0.00 9.71 1.97 1.00 0.12 0.84 1.00 Network scientists 0.74 0.75 0.00 2.66 1.47 1.00 0.85 0.95 1.00 Computer scientists 0.48 0.54 0.00 4.08 1.42 1.00 0.64 0.95 1.00 Plasmodium falciparum 0.02 0.07 0.00 3.71 1.77 1.00 0.43 0.95 1.00 Saccharomyces cerevisiae 0.07 0.10 0.00 2.58 1.19 1.00 0.68 0.88 1.00 Caenorhabditis elegans 0.06 0.12 0.00 6.79 3.03 1.00 0.56 0.85 1.00 AS (January 1, 1998) 0.18 0.21 0.00 3.87 2.32 1.00 0.66 0.91 1.00 AS (January 1, 1999) 0.18 0.27 0.00 3.54 2.05 1.00 0.49 0.95 1.00 AS (January 1, 2000) 0.20 0.25 0.00 4.81 3.07 1.00 0.59 0.90 1.00 Little Rock Lake 0.32 0.69 0.00 22.13 4.32 1.00 0.02 0.82 1.00 Florida Bay (wet) 0.33 0.79 0.00 9.17 1.37 1.00 0.03 0.92 1.00 Florida Bay (dry) 0.33 0.82 0.00 9.37 1.65 1.00 0.03 0.93 1.00
convex skeleton is generalization of spanning tree retaining clustering
10/14
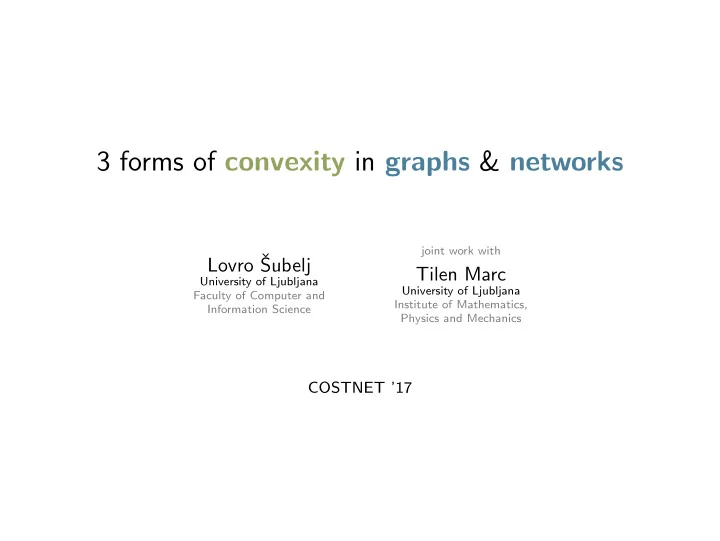
distributions of convex skeletons & spanning trees of networks
10 10
1
10
2
10
−3
10
−2
10
−1
10
Network scientists
fraction of nodes pk node degree k
Full network Spanning tree Convex skeleton 10 10
1
10
2
10
3
10
−3
10
−2
10
−1
10
AS (January 1, 1999)
fraction of nodes pk node degree k
Full network Convex skeleton Power−law ∼k−2.17 10 10
1
10
2
10
3
10
−4
10
−3
10
−2
10
−1
10
Caenorhabditis elegans
fraction of nodes pk node degree k
Full network Convex skeleton Power−law ∼k−2.28 2 4 6 8 10 12 14 16 0.05 0.1 0.15 0.2 0.25
Network scientists
fraction of nodes pd node distance d
Full network Spanning tree Convex skeleton 2 4 6 8 10 12 14 16 0.1 0.2 0.3 0.4 0.5
AS (January 1, 1999)
fraction of nodes pd node distance d
Full network Spanning tree Convex skeleton 2 4 6 8 10 12 14 16 0.1 0.2 0.3 0.4 0.5
Caenorhabditis elegans
fraction of nodes pd node distance d
Full network Spanning tree Convex skeleton
convex skeletons retain distributions in contrast to spanning trees
11/14
convex skeleton ∼ network abstraction technique convex skeleton of Slovenian computer scientists coauthorships
computer theory ( ), information systems ( ), intelligent systems ( ), programming technologies ( ) & other ( )
12/14
convex skeleton ≫ high-betweenness & high-salience backbones properties of backbones of Slovenian computer scientists coauthorships
2 2.2 2.4 2.6 2.8 3 3.2 3.4 3.6 3.8 4
weight of coauthorship ties 〈w〉 backbone
0.2 0.22 0.24 0.26 0.28 0.3 0.32 0.34 0.36 0.38 0.4
modularity of field classification Q backbone
0.73 0.74 0.75 0.76 0.77 0.78 0.79 0.8 0.81 0.82
fraction of inter−field ties remainder
Full network Spanning tree Edge betweenness Salience skeleton Convex skeleton
convex skeletons enhance properties in contrast to other backbones
13/14
tree w/o cliques
tree w/ cliques
abstraction, sampling, visualization, modeling, dynamics etc.
14/14
ˇ Subelj (2017) Convex skeletons of complex networks, pp. 19
Lovro ˇ Subelj
University of Ljubljana lovro.subelj@fri.uni-lj.si http://lovro.lpt.fri.uni-lj.si