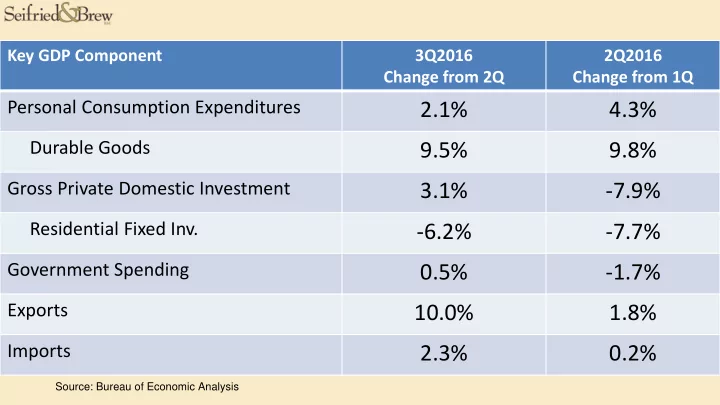
3 1 7 9
play

3.1% -7.9% Residential Fixed Inv. -6.2% -7.7% Government - PowerPoint PPT Presentation

Key GDP Component 3Q2016 2Q2016 Change from 2Q Change from 1Q Personal Consumption Expenditures 2.1% 4.3% Durable Goods 9.5% 9.8% Gross Private Domestic Investment 3.1% -7.9% Residential Fixed Inv. -6.2% -7.7% Government Spending


  1. Key GDP Component 3Q2016 2Q2016 Change from 2Q Change from 1Q Personal Consumption Expenditures 2.1% 4.3% Durable Goods 9.5% 9.8% Gross Private Domestic Investment 3.1% -7.9% Residential Fixed Inv. -6.2% -7.7% Government Spending 0.5% -1.7% Exports 10.0% 1.8% Imports 2.3% 0.2% Source: Bureau of Economic Analysis

  2. *Change in Inventories: 0.61% Source: Bureau of Economic Analysis

  3. Final Sales to Domestic Purchasers 2016Q3 2016Q2 2016Q1 2015 2014 2013 1.4% 2.4% 1.2% 3.1% 2.6% 1.2% Final sales to domestic purchasers is gross domestic purchases less change in private inventories. Source: Bureau of Economic Analysis

Download Presentation
Download Policy: The content available on the website is offered to you 'AS IS' for your personal information and use only. It cannot be commercialized, licensed, or distributed on other websites without prior consent from the author. To download a presentation, simply click this link. If you encounter any difficulties during the download process, it's possible that the publisher has removed the file from their server.

Recommend


More recommend