
SLIDE 1
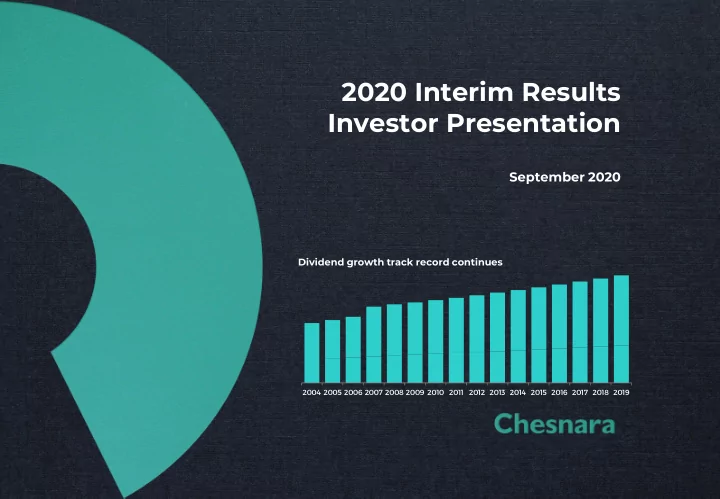
2020 Interim Results Investor Presentation
September 2020
2004 2005 2006 2007 2008 2009 2010 2011 2012 2013 2014 2015 2016 2017 2018 2019
Dividend growth track record continues
2020 Interim Results Investor Presentation September 2020 Dividend - - PowerPoint PPT Presentation
2020 Interim Results Investor Presentation September 2020 Dividend growth track record continues 2004 2005 2006 2007 2008 2009 2010 2011 2012 2013 2014 2015 2016 2017 2018 2019 AGENDA OVERVIEW John Deane, Chief Executive Officer 2020
September 2020
2004 2005 2006 2007 2008 2009 2010 2011 2012 2013 2014 2015 2016 2017 2018 2019
Dividend growth track record continues
OVERVIEW ● John Deane, Chief Executive Officer
2020 interim headlines Strategic delivery 2020 interim financial highlights
BUSINESS REVIEW ● John Deane, Chief Executive Officer
UK Sweden Netherlands Acquisition strategy
FINANCIAL REVIEW ● David Rimmington, Group Finance Director
Measuring our performance IFRS pre-tax profit & total comprehensive income Cash generation Symmetric adjustment Solvency II Value growth and EcV Sensitivities Covid-19 impact Asset analysis
CONCLUSION & OUTLOOK ● John Deane, Chief Executive Officer
Future priorities
APPENDICES
CHESNARA | 2020 INTERIM RESULTS PRESENTATION
AGENDA
1
2 CHESNARA | 2020 INTERIM RESULTS PRESENTATION
OVERVIEW
2
OVERVIEW: 2020 INTERIM HEADLINES STRATEGIC DELIVERY
Back to Contents
3 CHESNARA | 2020 INTERIM RESULTS PRESENTATION
Group is OPERATIONALLY RESILIENT in the Covid-19 environment, with most staff working remotely CONTINUED ROBUST SOLVENCY Solvency margin at 162% (2019 y/e: 155%) CLOSING ECV OF £604M down from £670m at 2019 year end impacted by Covid market conditions GROUP CASH GENERATION OF £12.9M Contributing to a Chesnara PLC closing cash balance of £77.1m (2019 y/e: £75.5m) INTERIM DIVIDEND GROWTH OF 3% Interim dividend per share 7.65p (2019: 7.43p) IFRS PRE-TAX LOSS £(9.1)m (2019 HY: £66.6m) impacted by Covid market conditions £35M OF DIVISIONAL DIVIDENDS PAID during H1 2020
OVERVIEW: STRATEGIC DELIVERY STRATEGIC DELIVERY
Dividend increased by 3% supported by solid cash generation
During the first half of 2020, despite difficult investment market conditions, Chesnara delivered positive cash generation; however, there was a reduction in own funds. The headline cash result has benefitted from a foreign exchange gain due to the weakening of sterling against the euro and Swedish krona, alongside the positive impact of the symmetric adjustment. Prudent financial and operational management has resulted in Chesnara’s
Back to Contents
`MAXIMISE VALUE FROM EXISTING BUSINESS ACQUIRE LIFE AND PENSION BUSINESSES ENHANCE VALUE THROUGH NEW BUSINESS Cash generation from all divisions except Scildon has created a total group cash of £12.9m. Economic Value has reduced by 6.7% pre-dividend predominantly due to external market conditions. The acquisition of a portfolio from Argenta Insurance in the Netherlands (announced in 2019) was completed on 31 August 2020 at a 22% discount to EcV and implemented onto Waard
c£6.9m of Economic Value and future cash potential. Total commercial new business profits of £6.7m at half year. CHESNARA CULTURE AND VALUES – Group solvency ratio of 162% at the end of H1 2020 which is a 7% increase on the 2019 y/e position of 155%. – Continuing to focus on delivering good customer outcomes and delivering the same levels of customer service in a Covid-19 operating environment. – Continuing to apply the Chesnara governance and risk culture practices. – Ongoing constructive relationships with UK, Swedish and Dutch regulators. Shareholder return: 3% dividend growth Interim dividend increased by 3% to 7.65p per share (2019: 7.43p interim and 13.87p final). 01 02 03
4 CHESNARA | 2020 INTERIM RESULTS PRESENTATION
OVERVIEW: 2020 INTERIM FINANCIAL HIGHLIGHTS (1 OF 2) 2020 FINANCIAL HIGHLIGHTS
IFRS SOLVENCY
IFRS PRE-TAX LOSS
£(9.1)m
GROUP SOLVENCY
162%
2019 HY: £66.6m 2019 y/e: 155%
The result includes £25.0m of losses relating to economic market conditions created by the Covid-19 pandemic, including an impairment of £11.6m to the Scildon AVIF. By contrast, economic conditions created a £43.2m gain during the first half of 2019. We are well capitalised at both group and subsidiary level under Solvency II, with the group solvency ratio improving in the first six months of 2020.
IFRS TOTAL COMPREHENSIVE INCOME
£15.1m
2019 HY: £51.0m
The 2020 result includes a foreign exchange gain of £21.9m (2019: loss of £3.5m).
ECONOMIC VALUE CASH GENERATION
ECONOMIC VALUE
£604.2m
GROUP CASH GENERATION
£12.9m
2019 y/e: £670.0m 2019 HY: £13.4m
Movement in the year is after dividend distributions of £20.8m and includes a foreign exchange gain of £29.1m. The result for the period includes a positive impact from the symmetric adjustment of c£26m.
ECONOMIC VALUE EARNINGS
£(74.1)m
DIVISIONAL CASH GENERATION
£9.6m
2019 HY: £47.1m 2019 HY: £2.4m
The result includes £53.6m of economic losses resulting from investment market movements (2019 HY: gain of £85.3m). In the period divisional dividends of £35m have been paid and a further £5m has been paid in September.
Back to Contents
5 CHESNARA | 2020 INTERIM RESULTS PRESENTATION
OVERVIEW: 2020 INTERIM FINANCIAL HIGHLIGHTS (2 OF 2) 2020 FINANCIAL HIGHLIGHTS
ECONOMIC BACKDROP NEW BUSINESS PROFIT
THE COVID-19 PANDEMIC HAS LED TO FALLING INTEREST RATES, REDUCED EQUITY PRICES AND STERLING DEPRECIATION IN 2020 COMMERCIAL NEW BUSINESS
£6.7m
2019 HY: £7.6m
The financial results for the first half of 2020 are reflective of the deterioration in investment markets witnessed since the turn of the
equity markets have driven economic losses. The impact of these factors has been felt, to varying degrees, across all financial metrics. A weakening of sterling against the euro and Swedish krona has led to foreign exchange translation gains. Scildon has reported a 37% improvement over the corresponding period in 2019, increasing market share in both term and individual life markets. Pricing pressures and changes to fee income and rebates continue to suppress Movestic’s new business value, with more modest returns of £1.7m.
DIVIDEND DUTCH ACQUISITIONS
INTERIM DIVIDEND INCREASE
3%
EXPANSION IN THE NETHERLANDS CONTINUES
2019: 3%
Interim dividend increased by 3% to 7.65p per share (2019: 7.43p interim and 13.87p final). Operations in the Netherlands continued to grow following regulatory approval of a portfolio acquisition from Argenta Bank (announced in 2019), at a discount to EcV of c22%, which completed on 31 August 2020 and adds c£6.9m of EcV.
Back to Contents
6 CHESNARA | 2020 INTERIM RESULTS PRESENTATION
CHESNARA | 2020 INTERIM RESULTS PRESENTATION
BUSINESS REVIEW
7
BUSINESS REVIEW: UK BUSINESS REVIEW: UK
The division manages c247,000 policies and is in run-off. Countrywide Assured follows an outsourcer based operating model, with a central governance team responsible for managing all outsourced operations.
MAXIMISE VALUE FROM EXISTING BUSINESS
BACKGROUND INFORMATION INITIATIVES & PROGRESS IN 2020 KPI’s FUTURE PRIORITIES CAPITAL & VALUE MANAGEMENT
creates value through managing: costs, policy attrition, investment return, and reinsurance strategy.
value is ensuring that the division is well governed.
progressed well.
supported value growth.
months has worsened compared to 2019, principally as a result of the Covid-19 driven fall in equity markets.
rationalisation programme.
Group with acquisitions.
investment strategy and asset mix is appropriate. CUSTOMER OUTCOMES
We achieve this by effective customer service and competitive fund performance whilst giving full regard to all regulatory matters.
customers’ needs in the Covid-19
that enable customers to contact us in new ways.
completed and signed off.
Covid-19 new environment.
product reviews and new ways to ‘stay in touch’.
policyholders in low risk manner. GOVERNANCE
governance and a constructive relationship with regulators is key to our strategy.
processes provides management with a platform to deliver the other aspects of the business strategy.
despite Covid-19 situation, primarily
model.
has progressed well.
we have selected WTW as the group provider of the contractual service margin (CSM) tool.
decisions and operational impact of the IFRS 17 programme, including implementing the CSM tool.
Back to Contents
8 Solvency ratio: 141% CHESNARA | 2020 INTERIM RESULTS PRESENTATION
BUSINESS REVIEW: SWEDEN (1 of 2)
Back to Contents
9
BUSINESS REVIEW: SWEDEN
Movestic is a life and pensions business based in Sweden and is open to new business. From its Stockholm base, Movestic
solutions through brokers and is well-rated within the broker community.
MAXIMISE VALUE FROM EXISTING BUSINESS
BACKGROUND INFORMATION INITIATIVES & PROGRESS IN 2020 KPI’s FUTURE PRIORITIES CAPITAL & VALUE MANAGEMENT
generating growth in the unit-linked assets under management (AuM), whilst assuring a high quality customer proposition and maintaining an efficient
releasing £1m of surplus.
down when compared to the start of 2020.
competitive market. Despite the adverse transfer ratio, the division continues to report positive net client cash flows.
the EcV at half year by £3.2m.
resulted in £16.6m reduction to EcV driven by assumption changes, along with an economic loss of £21.9m in the period.
digitalisation and automation.
more digitalised customer proposition.
and sustainable dividend to Chesnara. CUSTOMER OUTCOMES
personalised long-term savings, insurance policies and occupational pensions for individuals and business
through advisors and licenced brokers.
return of (7.4)% in the year (2019 HY: 11.7%) driven by equity market falls.
has been a key focus in light of Covid-19 with processes adjusted to ensure customer service continues at an acceptable level.
new solutions and tools to support the brokers’ value enhancing customer proposition.
direct distribution channels.
service offering.
with improved functionality. POLICYHOLDER AVERAGE INVESTMENT RETURN: (7.4)% CHESNARA | 2020 INTERIM RESULTS PRESENTATION
BUSINESS REVIEW: SWEDEN (2 of 2) BUSINESS REVIEW: SWEDEN
MAXIMISE VALUE FROM EXISTING BUSINESS
BACKGROUND INFORMATION INITIATIVES & PROGRESS IN 2020 KPI’s FUTURE PRIORITIES GOVERNANCE Movestic operates to exacting regulatory standards and adopts a robust approach to risk management. Maintaining strong governance is a critical to the division.
been a key focus, including ensuring operating in line with government guidelines.
functionality, revised working practices and well-being of staff
digitalisation programme has progressed well and is expected to be completed in H2 2020.
we have selected WTW as the group provider of the CSM tool.
monitored with options for office returns being reviewed regularly.
application decisions and operational impact
programme, including implementing the CSM tool.
ENHANCE VALUE THROUGH PROFITABLE NEW BUSINESS
BACKGROUND INFORMATION INITIATIVES & PROGRESS IN 2020 KPI’s FUTURE PRIORITIES As an “open” business, Movestic not
gains scale, it will become increasingly cash generative. Movestic has a clear sales focus and targets a market share of 6% - 10% of the advised occupational pension market.
the period (2019 HY: £3.9m). The reduction compared with the same period in 2019 is largely as a result of reduced sales volumes, largely driven by Covid-19 dynamics..
a new decumulation service for annuity planning.
insurance for broker channel.
products in a common broker hub.
to the smaller brokers.
business within the target range.
processes.
Back to Contents
10 Solvency ratio: 184% CHESNARA | 2020 INTERIM RESULTS PRESENTATION
*New business figures from 2018 onwards have been calculated using the commercially realistic metric. Values prior to this are retained at that which they were previously reported.
BUSINESS REVIEW: NETHERLANDS (1 of 2)
Back to Contents
11
BUSINESS REVIEW: NETHERLANDS
Our Dutch businesses aim to deliver growth and earnings through their dual closed and open book approach and through the group acquisition strategy will integrate portfolios and businesses into their operations.
MAXIMISE VALUE FROM EXISTING BUSINESS
BACKGROUND INFORMATION INITIATIVES & PROGRESS IN 2020 KPI’s FUTURE PRIORITIES CAPITAL & VALUE MANAGEMENT Both Waard and Scildon have a common aim to make capital available.
the benefit that the capital requirements reduce in-line with the attrition of the book.
adds value and creates surplus capital through writing new business and by efficient operational management and capital
solvency remains strong (inclusive of the volatility adjustment and foreseeable dividends of £12.7m) but Scildon is currently below the internal capital management policy (185%).
based return through de-risking its asset portfolio and investing into mortgage funds with £170m held as at 30 June 2020.
solvency levels, the ratio rising to 557% in the period.
dividends to group.
acquisition into Waard.
improvement plan.
management and cash generation initiatives. CUSTOMER OUTCOMES
providing customers with high quality service and positive outcomes.
the end customer, in Scildon we also see the brokers who distribute our products as being customers and hence developing processes to best support their needs is a key focus.
the Covid-19 pandemic and continue to support them in any way we can.
and digitalisation of its policy administration system, which is expected to complete in 2021.
consumers shows high scores.
with its customers.
migration and digitalisation of the Scildon IT platform.
its broker network. CHESNARA | 2020 INTERIM RESULTS PRESENTATION
BUSINESS REVIEW: NETHERLANDS (2 of 2) BUSINESS REVIEW: NETHERLANDS
MAXIMISE VALUE FROM EXISTING BUSINESS
BACKGROUND INFORMATION INITIATIVES & PROGRESS IN 2020 KPI’s FUTURE PRIORITIES GOVERNANCE Waard and Scildon operate in a regulated environment and comply with rules and regulations both from a prudential and from a financial conduct point of view.
and we have selected WTW as the group provider of the CSM tool.
application decisions and operational impact
programme, including implementing the CSM tool.
ENHANCE VALUE THROUGH PROFITABLE NEW BUSINESS
BACKGROUND INFORMATION INITIATIVES & PROGRESS IN 2020 KPI’s FUTURE PRIORITIES Scildon brings a “new business” dimension to the Dutch division. Scildon sell protection, individual savings and group pensions contracts via a broker-led distribution model.
conditions, continued progress in new business profits, earning £5.0m in the period on a commercial basis. It is expected that the full impact of Covid will be felt in H2 2020.
relationship with Dazure.
2020 has risen to 16.9%, although the market size has decreased, partly as a result of Covid-19.
to increase.
product innovation and cost management actions.
routes to market that do not compromise our existing broker relationships.
Back to Contents
12 Scildon solvency ratio: 183% Waard solvency ratio: 557% CHESNARA | 2020 INTERIM RESULTS PRESENTATION
*New business figures from 2018 onwards have been calculated using the commercially realistic metric. Values prior to this are retained at that which they were previously reported.
BUSINESS REVIEW: ACQUISITION STRATEGY ACQUIRE LIFE & PENSION BUSINESSES
Well considered and appropriately priced acquisitions maintain the effectiveness of the operating model, create a source of value enhancement and sustain the cash generation potential of the group.
ACQUISITIONS UPDATE DURING THE YEAR During 2020 the group has continued pursuing its acquisition strategy. In particular: 1. Argenta transaction – the group announced on 22 November 2019 that it had entered into an agreement to acquire a portfolio of life insurance business in run-off from the Dutch branch of Belgian-owned Argenta Bank-en Versekeringsgroep N.V. The transaction completed on 31 August 2020 and is expected to be both earnings and EcV accretive. The portfolio was converted on to our systems in Waard in early September demonstrating our strong operational capability in a COVID environment. 2. Other opportunities – management has continued to pursue wider acquisition opportunities for the group. This involves a combination of making sure we are in regular contact with investment banks and advisers and making direct contact with potential sellers when deemed appropriate. This work continues to support our views that the acquisition market is buoyant and supports the group’s ongoing acquisition strategy. ACQUISITION OUTLOOK – We have continued to witness acquisition activity in the year to date, particularly in Europe. – The environment in which European life insurance companies operate continues to increase in complexity, such as the forthcoming application of IFRS 17. We believe this will potentially drive further consolidation as institutions seek to remove
proven ability to integrate portfolios quickly in the Netherlands and the UK and our ability to offer white label products in the Netherlands for those who wish to retain product offerings will be increasingly attractive in this market.
Back to Contents
13 CHESNARA | 2020 INTERIM RESULTS PRESENTATION
14 CHESNARA | 2020 INTERIM RESULTS PRESENTATION
FINANCIAL REVIEW
FINANCIAL REVIEW: MEASURING OUR PERFORMANCE MEASURING OUR PERFORMANCE
We use a number of measures to assess and report how well we have performed. The range is broad and includes many measures that are not based on IFRS. The financial analysis of a life and pensions business also needs to recognise the importance of Solvency II figures, the basis
regulatory solvency.
SOLVENCY ECONOMIC VALUE (EcV) CASH GENERATION
Solvency is a fundamental financial measure which is
paramount importance to investors and policyholders. It represents the relationship between the value of the business as measured on a Solvency II basis and the capital the business is required to hold. Solvency can be reported as an absolute surplus value or as a ratio. Solvency gives policyholders comfort regarding the security of their provider. This is also the case for investors together with giving them a sense of the level of potential surplus available to invest in the business or distribute as dividends (subject to other considerations and approvals). Economic Value (EcV) is deemed to be a more meaningful measure of the long term value of the group and it generally approximates to Embedded Value reporting. In essence, the IFRS balance sheet is not generally deemed to represent the fair commercial value of our business as it does not fully recognise the impact of future profit expectations of long term policies. New business An element of the EcV earnings each period is the economic value of new business. Factoring in the real world investment returns and removing the impact of risk margins is used by the group to determine the value of new business on a commercial basis. Cash generation is used by the group as a measure
been generated, subject to ensuring
constraints are managed. Group cash generation is calculated as the movement in the group’s surplus own funds above the group’s internally required capital. Divisional cash generation represents the movement in surplus own funds above local capital management policies within the three operating divisions of Chesnara. Divisional cash generation is used as a measure of how much dividend potential a division has generated, subject to ensuring other constraints are managed.
Back to Contents
15
FINANCIAL STATEMENTS ADDITIONAL METRICS
IFRS net assets Solvency II valuation (own funds) I Capital requirements R
Solvency capital requirement SCR plus management buffer
I Economic Value IFRS profits P R Solvency Balance sheet Earnings I B % Absolute STAKEHOLDER FOCUS: Policyholders P Investors I Regulators R I New business I Cash generation Business partners B B EcV Basis Commercial Basis Group Divisional Key performance indicators CHESNARA | 2020 INTERIM RESULTS PRESENTATION
FINANCIAL REVIEW: IFRS PRE TAX PROFIT & TOTAL COMPREHENSIVE INCOME IFRS
The group IFRS results reflect the natural dynamics of the segments of the group, which can be characterised in three major components: stable core; variable element; and growth operation.
ANALYSIS OF MOVEMENT
directly driven by movements in economic variables. During 2020, all divisions suffered from adverse market conditions, as a consequence of the Covid-19 pandemic.
economic performance.
resulting in a sizeable exchange gain year to date.
reassessment performed at 30 June 2020.
DIVISIONAL PERFORMANCE
IFRS pre-tax profits are significantly lower than 2019 with the primary change being driven by the movement in Scildon’s and CA’s results.
term policy experience driven by a recovery in credit and country spreads in Q2.
this, coupled with reducing bond yields, has led to an overall negative economic return.
IFRS result but posting a slightly lower return when compared to the prior half year period due to lower investment results.
slightly higher than expected acquisition related expenditure.
Back to Contents
16 CHESNARA | 2020 INTERIM RESULTS PRESENTATION
6 months ended 30 Jun 20 30 Jun 19 £m £m CA 0.4 25.8 Movestic 4.0 6.5 Waard Group (0.2) 3.5 Scildon 7.2 36.4 Chesnara (5.8) (2.9) Consolidation adjustments (14.7) (2.7) (Loss)/profit before tax (9.1) 66.6 Tax 2.3 (12.3) (Loss)/profit after tax (6.8) 54.3 Foreign exchange 21.9 (3.5) Other comprehensive income
Total comprehensive income 15.1 51.0
FINANCIAL REVIEW: CASH GENERATION CASH GENERATION
The Swedish division has delivered a significant cash contribution despite difficult economic conditions, supporting a total cash generation of £12.9m for the first half of 2020.
GROUP CASH GENERATION
The headline cash results of £12.9m is relatively modest but as expected following the Covid-19 market turmoil. Divisional cash of £9.6m was generated with Movestic being the lead contributor. The headline cash result is heavily impacted by technical matters such as: the symmetric adjustment; with-profit restrictions; and model enhancements. The half year figures include £35m of divisional dividends received, with a further £5m received in September 2020. Chesnara Plc has cash and other highly liquid assets of £77.1m at 30 June 2020 (£75.5m at 31 December 2019) and expects future short term outflows of £11.5m for payment of the interim dividend and 2020 debt and interest repayments of £8.2m. As noted above, the Waard divisional dividend of £5.2m was received in September.
DIVISIONAL PERFORMANCE
primarily from economic losses. Prior year comparison benefitted from a £7.9m release from the with-profits fund.
division was heavily impacted by equity falls in the period owing to the nature of the business, but this was offset by significantly larger reductions in capital requirements owing in part to the symmetrical adjustment, alongside strong FX gains.
with a reduction in Own Funds due to a fall in equity and bond values, being offset by a similar decrease in capital requirements.
requirements, resulting in cash utilisation of £19.5m driven by downward pressure on yields and widening of spreads but softened somewhat by the application of the VA. A large element of Scildon’s lapse risk SCR is reversed out on consolidation at the Chesnara level due to a different group biting constraint
Back to Contents
17 CHESNARA | 2020 INTERIM RESULTS PRESENTATION
4.7 21.7 2.8 (19.5) 3.3 16.2 (8.0) 1.7 (7.4) 11.1 UK Sweden Netherlands: Waard Netherlands: Scildon Other group activities
Divisional cash generation £m
2020 HY 2019 HY
12.9 13.4 48.6 2020 HY 2019 HY 2018 HY
Cash generation - historical profile (£m)
FINANCIAL REVIEW: SYMMETRIC ADJUSTMENT SYMMETRIC ADJUSTMENT
The group cash generation result of £12.9m includes an estimated cash benefit of c£26m as a result of the symmetric adjustment impact during H1 2020, primarily driven by CA and Movestic's results.
WHAT IS THE SYMMETRIC ADJUSTMENT?
The Solvency II capital requirement calculation includes an adjusting factor that reduces or increases the level of the equity capital required depending on historical market conditions. Following periods of market growth, the factor tends to increase the level of capital required and conversely, in falling markets the capital requirement becomes less onerous. The adjustment is applied to the equity stress base percentage each reporting period. The rationale for the adjustment is to reduce the impact in a downwards market and reflect that if equities have already suffered a material fall, then a further 1-in-200 year fall would be less than in the typical position.
HOW MIGHT THE SYMMETRIC ADJUSTMENT IMPACT RESULTS IN THE FUTURE?
The symmetric adjustment can create a swing in the SCR value each period up to an adjustment of +/- 10%. If you are at one of the extremities
adjustment is +1%or -19%.
WHO SETS THE SYMMETRIC ADJUSTMENT?
The adjustment is set by the European Insurance and Occupational Pensions Authority (EIOPA). The adjustment is provided each month and is calculated on a rolling three year basis. The adjustment tends towards zero in a period of normal equity market movements but as it is calculated using a rolling average, a period of minimal movement can still see a shift in the adjustment. This information is publicly available on the EIOPA website (https://eiopa.europa.eu/regulation-supervision/insurance/solvency-ii-technical-information/symmetric-adjustment-of-the- equity-capital-charge).
Back to Contents
SCR impact +c£40m (c£40m) Symmetric adjustment +10%
Symmetric adjustment per quarter 6 monthly movement
CHESNARA | 2020 INTERIM RESULTS PRESENTATION 18 Q1 2017, 1.36% Q2 2017, 0.90% Q3 2017, 2.40% Q4 2017, 1.90% Q1 2018,
Q2 2018,
Q3 2018, 0.14% Q4 2018,
Q1 2019,
Q2 2019,
Q3 2019, -1.97% Q4 2019, -0.08% Q1 2020, -10.00% Q2 2020, -6.72%
FINANCIAL REVIEW: SOLVENCY II SOLVENCY II
We are well capitalised at both a group and subsidiary level.
GROUP SOLVENCY SOLVENCY SURPLUS GENERATION CONTEXT
Covid-19 pandemic, partially offset by positive exchange rate variance.
The group solvency ratio has increased from 155% (at 31/12/19) to 162% whilst solvency surplus has fallen by £3.1m.
Back to Contents
19 CHESNARA | 2020 INTERIM RESULTS PRESENTATION
KEY Own Funds (post Div) SCR Buffer Surplus
FINANCIAL REVIEW: VALUE GROWTH & ECV (1 of 2) VALUE GROWTH & EcV
The reduction in the group EcV is reflective of a challenging start to the year and the impact of Covid-19 on investment market conditions, with falling interest rates, widening spreads and diminished equity returns.
What is economic value?
The Economic Value of Chesnara represents the present value of future profits of the existing insurance business, plus the adjusted net asset value of the non-insurance business within the group. EcV is an important reference point by which to assess Chesnara’s intrinsic value. EcV MOVEMENT OVER 2020
2020.
investment market conditions and subsequent substantial economic losses across the divisions.
final 2019 dividend.
Swedish divisional results, representing the weakening of sterling against the euro and Swedish krona. EcV EARNINGS
earnings were offset by larger economic losses.
year, predominantly due to economic losses as well as adverse non-recurring operating items.
Dutch businesses, with the division reporting a loss of £12.7m for the period. Scildon incurred a loss of £10.8m, largely reflecting economic losses owing to falling yields and a widening of spreads. The impact of this was softened by the application of the volatility adjustment.
Back to Contents
20 CHESNARA | 2020 INTERIM RESULTS PRESENTATION £m CA Movestic Scildon Waard Other group activities Total 2020 half year
(14.5) (41.6) (10.8) (1.9) (5.4) (74.1)
2019 half year
25.2 13.9 6.5 1.6 (0.1) 47.1
FINANCIAL REVIEW: VALUE GROWTH & ECV (2 of 2) VALUE GROWTH
Back to Contents
21
COMPANY HISTORY WHAT WE HAVE DONE 2004
8
SUCCESSFUL ACQUISITIONS
3
TERRITORIES Our deals demonstrate flexibility and creativity where appropriate:
transformative deals
UK
solutions
to de-risk where required We are not willing to compromise on quality, value or risk. All deals have:
value
requirements of generating medium term cash and enhancing long term value
diligence
terms of customer outcomes
income stock Chesnara is born. EEV of £126m.
2005
First acquisition. CWA adds £30m of EEV.
2009
Chesnara moves into Europe acquiring Movestic in Sweden. Group EEV now £263m.
2010
S&P acquired. Group AuM over £4bn.
2013
Direct Line’s life assurance acquired end of 2014. Group EEV now above £400m.
2015
Expansion into the Netherlands. Waard group acquired.
2016
Building on our entry to the Dutch market, we announce the acquisition of LGN.
2017
Completion of Legal & General Nederland acquisition, renamed Scildon, at a 32% discount to its EcV of £202.5m.
2019
Completion of the acquisition of a portfolio from Monuta, under Waard group.
2020
Completion of the acquisition of 44,000 policies from the Dutch branch of Argenta Bank, also under Waard Group.
Value growth is achieved through a combination of efficient management
and writing profitable new business. The value of the group is affected by investment market conditions at any given point in time.
CHESNARA | 2020 INTERIM RESULTS PRESENTATION 126 176 189 187 183 263 355 295 311 376 417 455 603 723 626 670 604
Value Growth £m
SENSITIVITIES
The table provides some insight into the immediate and longer term impact of certain sensitivities that the group is exposed to, covering solvency, cash generation and economic value. 1
EcV tends to take the “full force”
adverse conditions whereas cash generation is
protected in the short term due to compensating impacts on our required capital.
2
A material sterling appreciation reduces the value of surplus in our overseas divisions and hence has an immediate impact on group cash generation. It also reduces the value of projected Own Funds growth in
3
The equity rise sensitivities cause both Own Funds and SCR to rise, as the value of the funds exposed to risk is higher. The increase in SCR is larger than Own Funds, resulting in an immediate impact on surplus. Since the year end, the equity stresses have become more sensitive due to a change in the starting position of the symmetric adjustment (2019 y/e:
4
An interest rate rise is generally positive across the
current low interest rate environment. CA, Movestic and Scildon all contribute towards the total group cash generation impact.
Solvency surplus Immediate impact Cash generation 5 year impact EcV Immediate impact 20% sterling appreciation 25% equity fall 25% equity rise 10% equity fall 10% equity rise 1% interest rate rise 1% interest rate fall
FINANCIAL REVIEW: SENSITIVITIES (1 of 2)
Back to Contents
1 2 3 4
CHESNARA | 2020 INTERIM RESULTS PRESENTATION 22
Key
£0m- £15m
£15m to £30m £30m to £50m £50m to £90m £90m to £140m
Positive impact Negative impact 2 2 5 1 1 1 4 4 3 3 3 1 2 2 2 3 4 5 1 2 2 3 3 3 3 4 4
SENSITIVITIES
5
Scildon has an exposure to credit spreads and both Scildon and CA are adversely affected by swap rate falls.
6
This sensitivity has a small impact on surplus as the reduction in Own Funds is largely offset by the SCR
is less potential for future profits. The division most affected is Movestic; the loss in future fee income following a mass lapse hits Own Funds by more than the reduction in SCR.
7
The expense sensitivity hits the solvency position immediately as the increase in future expenses and inflation is capitalised into the balance sheet.
8
This sensitivity has an adverse impact on surplus and cash generation, particularly for Scildon due to their term products.
Solvency surplus Immediate impact Cash generation 5 year impact EcV Immediate impact 50bps credit spread rise 25bps swap rate fall 10% mass lapse 10% expense + 1% inflation rise 10% mortality increase
FINANCIAL REVIEW: SENSITIVITIES (2 of 2)
Back to Contents
CHESNARA | 2020 INTERIM RESULTS PRESENTATION 23
Key
£0m- £15m
£15m to £30m £30m to £50m £50m to £90m £90m to £140m
Positive impact Negative impact BASIS OF PREPARATION ON REPORTING: Although it is not a precise exercise, the general aim is that the sensitivities modelled are deemed to be broadly similar (with the exception that the 10% equity movements are naturally more likely to arise) in terms of likelihood. Whilst sensitivities provide a useful guide, in practice, how our results react to changing conditions is complex and the exact level of impact can vary due to the interactions of events and starting position.
5 6 7 8
2 1 1 1 1 2 2 2 2 3 2 3 4 4 4 4 4 5 1 1 4
FINANCIAL REVIEW: COVID-19 IMPACT COVID-19 IMPACT
Across the group, we responded rapidly to the Covid-19 situation and implemented necessary changes to the
contact during 2020 but as we have noted throughout the report, Covid-19 has had a significant impact on many of the key economic metrics. Whilst it is not possible to isolate the impact of Covid alone, the table below considers the key metrics and the movements in the period.
FINANCIAL IMPACT In the 2019 year end investor presentation, we included an estimate for the solvency and EcV positions for the 31 March 2020. As can be seen from the figures in the table, solvency surplus and EcV have improved during the second quarter of 2020 as markets have recovered slightly. As noted above, it is not possible to isolate the impact of Covid but the movements in the key indices and their impact on the key metrics are as follows:
notable reductions in OF, somewhat offset by a reduction in the SCR including the benefits of the symmetric adjustment.
reduction in both own funds and SCR.
deterioration of surplus.
since the year end, which has had a positive impact on results.
has been offset by the VA particularly in Scildon.
OPERATIONAL IMPACT At the start of the lock down, we established a remote working model across the group and continue to operate under this
The situation in each of our territories is fluid, as restrictions are lifted or tightened, and we anticipate that this will continue to be the case; however, we are well positioned to adapt to these restrictions.
Back to Contents
24 CHESNARA | 2020 INTERIM RESULTS PRESENTATION
2019 year end 31 March 2020 estimate 2020 half year Own funds (£m) 591.0 543.0 SCR (£m) 380.0 335.0 Surplus (£m) 210.8 196.6 207.7 Solvency ratio (%) 155% 163% 162% EcV (£m) 670.0 579.0 604.2 2019 half year 2020 half year Cash generation (£m) 13.4 12.9 VNB (commercial) 7.6 6.7
FINANCIAL REVIEW: COVID-19 IMPACT ON LIQUIDITY COVID-19 IMPACT
LIQUIDITY ANALYSIS
Chesnara has cash and other highly liquid assets of £77.1m at 30 June 2020 which is a small increase on the closing position of 2019. Our projections for the second half of 2020 estimate closing cash at 31 December 2020
CHESNARA HALF YEAR CASH FLOW (2019 Y/E V 2020 HY) At the start of 2020, Chesnara had cash of £75.5m and at the end of H1 2020, closed with cash of £77.1m, an increase of £1.6m (2%). This movement includes £35.2m of divisional dividends being received (CA and Movestic) and also takes into account the payment of the final 2019 shareholder dividend. During the period, there have also been loan interest and repayments, tax and general expenses of £12.8m. PROJECTED CHESNARA CASH FLOW AT 31 DECEMBER 2020 We have already received the Waard divisional dividend of €5.75m and are projecting to pay the interim shareholder dividend of £11.5m. Compared to the projection we made at 2019 year end, the total divisional dividend has reduced, but despite this and after paying the shareholder dividends and all
at the end of 2020, supporting the robustness of the dividend strategy.
Back to Contents
25 CHESNARA | 2020 INTERIM RESULTS PRESENTATION 75.5 77.1 35.2 (20.8) (8.3) (4.5) Opening cash 2020 Divisional dividends received H1 2020 Shareholder dividends paid in H1 2020 Loan interest & repayments in H1 2020 Expenses & tax in H1 2020 Closing cash H1 2020 77.1 59.8 5.2 (11.5) (8.2) (2.8) Opening cash H2 2020 Divisional dividends expected H2 2020 Shareholder dividends paid in H2 2020 Loan interest & repayments expected H2 2020 Expenses & tax expected H1 2020 Projected closing cash 2020
FINANCIAL REVIEW: ASSET ANALYSIS ASSET ANALYSIS
Of the group’s non-linked £1.1bn debt securities, 62% (£685m) is invested in government issued bonds and 38% (£422m) in corporate stock. The government-issued bonds are spread over a number of countries and the corporate issued stock is spread across 12 different sectors.
INSIGHT The group has £1.1bn of non-linked debt securities. 79% of the corporate investments are in assets graded A or above and these investments are split across a diverse range of sectors, with over 70% invested in financial services and manufacturing. Of the £685m government issued debt securities held, the top 3 being Germany, France and Great Britain respectively. In aggregate, these three countries cover 62% of the total portfolio (£423m). Not included within the figures above are non-linked mortgage asset investments held within the Dutch divisions. Since the 2019 year end, Scildon has continued to optimise its risk-based return through de-risking its asset portfolio and investing into these mortgage funds and so at 30 June 2020, the mortgage assets for the group had increased to £202m from £65m at the end of 2019.
Back to Contents
26 CHESNARA | 2020 INTERIM RESULTS PRESENTATION Government issued by country £m Germany 148 France 148 Great Britain 127 Italy 38 Netherlands 40 Luxemburg 32 Spain 30 Austria 33 Belgium 26 Finland 22 Other 41 Total 685 685 422
Group non-linked debt securities
Government issued Corporate issued Corporate issued by sector £m Financial and insurance 147 Manufacturing 155 Transportation and storage 25 Electricity, gas, steam and air conditioning supply 35 Information and communication 29 Real estate 18 Other 13 Total 422 14 77 242 89 AAA AA A BBB BB
Corporate by rating (£m)
27
CONCLUSION & OUTLOOK
CHESNARA | 2020 INTERIM RESULTS PRESENTATION 27
CONCLUSION & OUTLOOK: FUTURE PRIORITIES CONCLUSION & OUTLOOK
The world is in an unprecedented position and the financial markets are experiencing significant volatility and uncertainty; however, Chesnara has delivered and continues to be in a position to deliver on its core strategic
Despite the market turmoil, we look to continue to deliver solid operational performance within our product and wider risk appetite in a secure and stable Chesnara. CHESNARA CULTURE AND VALUES Deliver value to our customers through our continued focus on:
DELIVERY ON CORE STRATEGIC OBJECTIVES DRIVES SHAREHOLDER VALUE
Back to Contents
MAXIMISE VALUE FROM EXISTING BUSINESS ACQUIRE LIFE AND PENSION BUSINESSES ENHANCE VALUE THROUGH NEW BUSINESS Temporary market volatility is a natural feature of investment markets and our financial model is well positioned to withstand difficult conditions without creating any permanent harm to the longer term profitability prospects. We believe that vendors’ desire to sell businesses or portfolios remains, especially where the vendor’s driver for selling a life business or portfolio is the need to release capital to sustain and fund core elements of the vendor’s business. In the medium to long term we have no reason to believe the market for term assurance and pension savings contracts will not recover to pre-Covid-19 levels. 01 02 03
28 CHESNARA | 2020 INTERIM RESULTS PRESENTATION
29 CHESNARA | 2020 INTERIM RESULTS PRESENTATION
29
APPENDIX 1: HISTORICAL PERFORMANCE HISTORICAL PERFORMANCE
Back to Contents
30
Jun-20 Dec-19 Dec-18 Dec-17 Dec-16 Dec-15 Dec-14 Dec-13 IFRS profit £m (pre-tax) (9.1) 96.1 27.0 89.6 40.7 42.8 28.8 57.8 EcV / EEV profit / (loss) £m (after tax) 1 (74.1) 104.0 (60.9) 139.5 72.5 57.5 44.2 82.7 EcV / EEV Shareholder equity £m 1 604.2 670.0 626.1 723.1 602.6 453.4 417.2 376.4 Solvency II ratio (UK)3 141% 131% 130% 130% 128% 135% n/a n/a Solvency II ratio (Sweden) 3 184% 155% 174% 153% 140% 154% n/a n/a Solvency II ratio (Netherlands - Waard) 3 557% 501% 624% 483% 712% 597% n/a n/a Solvency II ratio (Netherlands - Scildon) 3 183% 210% 203% 231% n/a n/a n/a n/a Solvency II ratio (Group) 2, 3 162% 155% 158% 146% 158% 146% n/a n/a Gearing ratio 10.0% 11.0% 15.6% 19.8% 13.4% 17.8% 23.1% 29.6%
1 From the 1st January 2016 we have moved from reporting on an embedded value basis to an economic value basis. 2 December 2016 Group solvency includes the impact of the capital raise and associated costs for the acquisition of LGN, removing this, the
ratio is 144%.
3 All solvency ratios above are stated post dividend
CHESNARA | 2020 INTERIM RESULTS PRESENTATION
31 CHESNARA | 2020 INTERIM RESULTS PRESENTATION
31
Disclaimer
This presentation has been issued by Chesnara plc (“Chesnara” or the “Company”) and is being made
falling within Article 19 of the Financial Services and Markets Act 2000 (Financial Promotion) Order 2005 (the “FPO”); or (b) high net worth entities, and other persons to whom it may otherwise lawfully be communicated, falling within Article 49 of the FPO (all such persons together being referred to as “relevant persons”); or (c) any other person to whom this promotion may lawfully be directed. Any person who is not a relevant person should not act or rely on this presentation or any of its contents. This presentation is supplied for information only and may not be reproduced or redistributed. This presentation is not and should not be construed as an offer to sell or the solicitation of an offer to purchase or subscribe for any investment nor shall it form the basis of or be relied upon in connection with, or act as any inducement to enter into, any contract or commitment whatsoever. This presentation may contain forward-looking statements with respect to certain of the plans and current expectations relating to future financial condition, business performance and results of
relate to future events and circumstances that are beyond the control of Chesnara including, amongst
conditions, market-related risks such as fluctuations in interest rates, inflation, deflation, the impact of competition, changes in customer preferences, delays in implementing proposals, the timing, impact and other uncertainties of future acquisitions or other combinations within relevant industries, the policies and actions of regulatory authorities, the impact of tax or other legislation and other regulations in the jurisdictions in which Chesnara and its subsidiaries operate. As a result, Chesnara’s actual future condition, business performance and results may differ materially from the plans, goals and expectations expressed or implied in these forward-looking statements. Chesnara undertakes no obligation to update the forward-looking statements contained in this presentation or any other forward-looking statements the Company may make.
32 CHESNARA | 2020 INTERIM RESULTS PRESENTATION
CHESNARA | 2019 FINAL RESULTS PRESENTATION 33