
SLIDE 1
8/20/2019 1
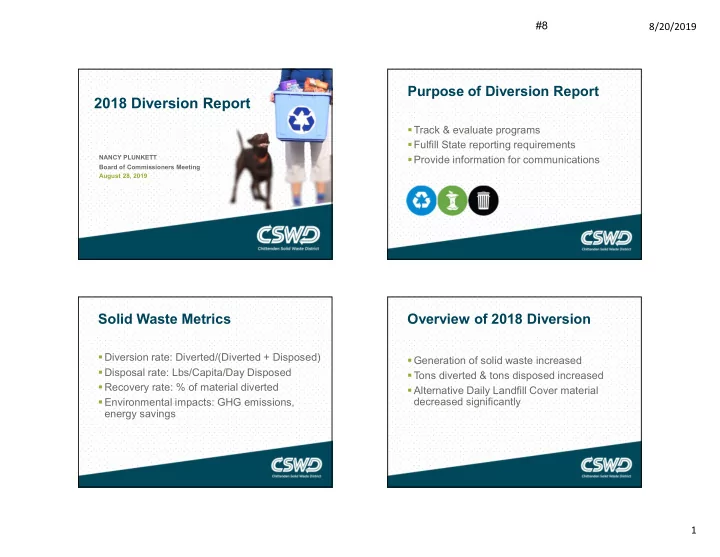
2018 Diversion Report
NANCY PLUNKETT Board of Commissioners Meeting August 28, 2019
Purpose of Diversion Report
- Track & evaluate programs
- Fulfill State reporting requirements
- Provide information for communications
Solid Waste Metrics
- Diversion rate: Diverted/(Diverted + Disposed)
- Disposal rate: Lbs/Capita/Day Disposed
- Recovery rate: % of material diverted
- Environmental impacts: GHG emissions,
energy savings
Overview of 2018 Diversion
- Generation of solid waste increased
- Tons diverted & tons disposed increased
- Alternative Daily Landfill Cover material