10/19/2010 DRAFTPreliminary work product Impact of Current Tort - - PDF document

10 19 2010
SMART_READER_LITE
LIVE PREVIEW

10/19/2010 DRAFTPreliminary work product Impact of Current Tort - - PDF document

10/19/2010 DRAFTPreliminary work product Impact of Current Tort Environment on Asbestos Reserves CAS 2010 Annual Meeting November 8, 2010 Charlie Mullin DRAFTPreliminary work product 2 Are insurers under or over reserved for asbestos


slide-1
SLIDE 1

10/19/2010 1

DRAFT—Preliminary work product

Impact of Current Tort Environment on Asbestos Reserves

CAS 2010 Annual Meeting

November 8, 2010 Charlie Mullin

DRAFT—Preliminary work product

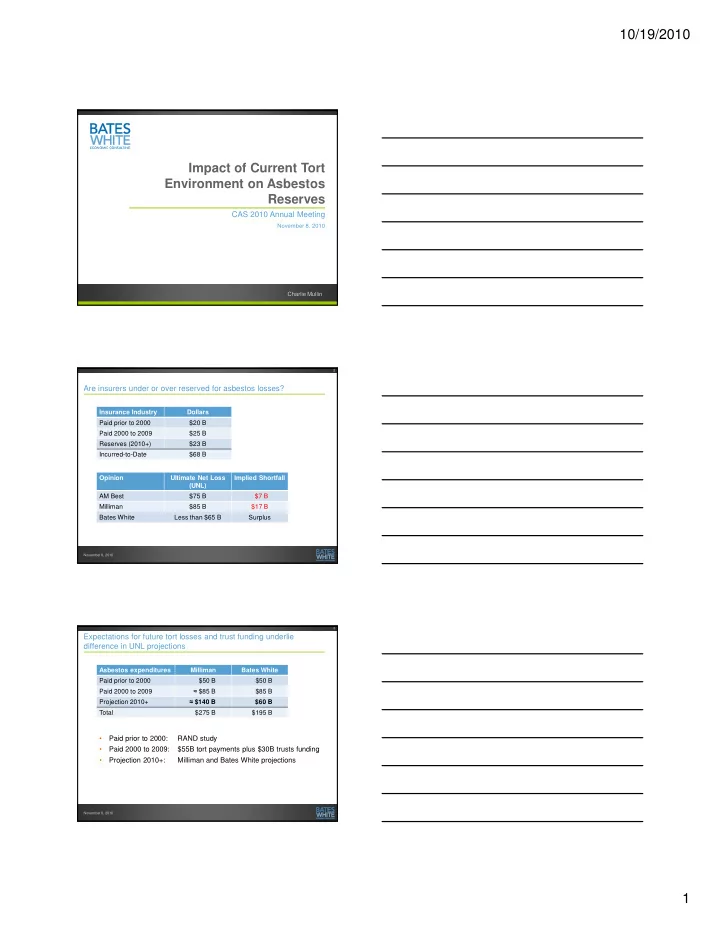
Are insurers under or over reserved for asbestos losses?

Insurance Industry Dollars Paid prior to 2000 $20 B Paid 2000 to 2009 $25 B Reserves (2010+) $23 B Incurred-to-Date $68 B

November 8, 2010 2

Opinion Ultimate Net Loss (UNL) Implied Shortfall AM Best $75 B $7 B Milliman $85 B $17 B Bates White Less than $65 B Surplus

DRAFT—Preliminary work product

Expectations for future tort losses and trust funding underlie difference in UNL projections

November 8, 2010 3

Asbestos expenditures Milliman Bates White Paid prior to 2000 $50 B $50 B Paid 2000 to 2009 $85 B $85 B Projection 2010+ $140 B $60 B Total $275 B $195 B

  • Paid prior to 2000:

RAND study

  • Paid 2000 to 2009:

$55B tort payments plus $30B trusts funding

  • Projection 2010+:

Milliman and Bates White projections

slide-2
SLIDE 2

10/19/2010 2

DRAFT—Preliminary work product

Agenda

  • Factors that drive asbestos litigation
  • Economic incentives
  • Epidemiology
  • Current litigation environment
  • Expected future litigation environment
  • Implications for reserves
  • IBNR for individual accounts
  • Portfolio Reserves

November 8, 2010 4 DRAFT—Preliminary work product

The rise and fall of mass recruitment

November 8, 2010 5 DRAFT—Preliminary work product

What can we learn form this experience—what would have lead someone in 2003 to predict the collapse in non-malignant claims?

5,000 10,000 15,000 20,000 25,000 1985 1987 1989 1991 1993 1995 1997 1999 2001 2003 2005 2007 2009

November 8, 2010 6 Source: Bates White

slide-3
SLIDE 3

10/19/2010 3

DRAFT—Preliminary work product

US asbestos tort filings by quarter through June 2003—the filing picture is dominated by the story of non-malignant recruitment

5,000 10,000 15,000 20,000 25,000 1985 1987 1989 1991 1993 1995 1997 1999 2001 2003 2005 2007 2009

November 8, 2010 7 Source: Bates White DRAFT—Preliminary work product

Non-malignant filings resulted from a site-centric claim mining process—Example of single site recruitment from Saginaw, MI

November 8, 2010 8

5 10 15 20 25 30 35 40 45 200 400 600 800 1,000 1,200 1,400 1,600 1,800 1986 1988 1990 1992 1994 1996 1998 Non-malignant Lung and other cancer Mesothelioma

Source: Bates White DRAFT—Preliminary work product

The market for non-malignant claim recruitment collapsed under its

  • wn weight

November 8, 2010 9 Source: Bates White 1,000 2,000 3,000 4,000 5,000 6,000 7,000

J FMAMJ J ASONDJ FMAMJ J ASONDJ FMAMJ J ASONDJ FMAMJ J ASONDJ FMAMJ J ASONDJ FMAMJ J ASONDJ FMAMJ J ASONDJ FMAMJ J AS

New non-malignant claims diagnosed per month

2000 2001 2002 2004 2003 2005 2006 2007

  • FAIR Act
  • Inactive dockets

in Cleveland, NYC, Seattle

  • Manville 2002

TDP

  • Nobel laureate

Joseph Stiglitz, former AG Griffin Bell publish high- profile reports

  • ABA

recommends medical criteria

  • Inactive docket

in Syracuse

  • Forum and

venue laws in AK, GA, TX, WV

  • Venue reform

in MS

  • Medical criteria

law in OH

  • Medical criteria

laws in FL, GA, TX

  • Forum and venue

laws in TX, GA, MO, SC

  • Judge Janis

Jack holds hearings in TX Silica MDL

slide-4
SLIDE 4

10/19/2010 4

DRAFT—Preliminary work product

Takeaways from our mass recruitment discussion

  • Mass recruitment of tort claims has ceased and is unlikely to

return

  • 95% decline in non-malignant claims
  • 60% decline in lung and other cancer claims
  • Major shifts have occurred and will happen again in the tort

environment

  • These shifts can be detrimental to defendants and insurers
  • These shifts can be beneficial to defendants and insurers
  • The recent historical tort environment has always been a poor

predictor of the likely future tort environment

  • Extrapolating the recent history is not a forecast
  • Forecasts should be scenario based and model for likely changes in

the tort environment

November 8, 2010 10 DRAFT—Preliminary work product

The current litigation landscape

November 8, 2010 11 DRAFT—Preliminary work product

Known and agreed upon facts

  • Mesothelioma claims dominate the current landscape
  • No one party observes all of the information
  • Defendants know their spend and only some disclose
  • Plaintiff law firms know the recoveries of only their claimants
  • Insurers observe a patchwork quilt
  • All data sources indicate the following trends
  • Non-mesothelial expenditures have declined
  • Mesothelioma expenditures (indemnity + defense) have increased
  • Total expenditures for the largest defendants have declined
  • Many new defendants have emerged
  • Wealthy 524(g) trusts have emerged

November 8, 2010 12

slide-5
SLIDE 5

10/19/2010 5

DRAFT—Preliminary work product

Total tort-based asbestos expenditures by year and disease

$0 B $1 B $2 B $3 B $4 B $5 B $6 B $7 B $8 B 2000 2001 2002 2003 2004 2005 2006 2007 2008 2009 2010 Defense Nonmalignant Lung and Other Cancers Mesothelioma

November 8, 2010 13 DRAFT—Preliminary work product

Building blocks of total tort expenditure

  • Building blocks
  • Distribution of defendant indemnity payments by disease
  • Defense-to-indemnity ratio
  • Number of mesothelioma claims
  • Value of a mesothelioma claim
  • Sanity checks
  • 10-K data
  • Verdicts
  • Insurance industry expenditures
  • Profits of plaintiff law firms

November 8, 2010 14 DRAFT—Preliminary work product

Distribution of defendant indemnity payments by disease

November 8, 2010 15

Year Mesothelioma Other cancer Non-malignant 1985 to 2000 35% 10% 55% 2001 35% 10% 55% 2002 35% 10% 55% 2003 35% 10% 55% 2004 35% 10% 55% 2005 55% 10% 35% 2006 65% 10% 25% 2007 80% 10% 10% 2008 82% 10% 8% 2009 84% 10% 6% 2010 85% 10% 5%

slide-6
SLIDE 6

10/19/2010 6

DRAFT—Preliminary work product

Defense costs relative to indemnity payments

November 8, 2010 16

Year Defense-to-Indemnity Ratio 2000 25% 2001 25% 2002 25% 2003 25% 2004 25% 2005 45% 2006 55% 2007 65% 2008 65% 2009 65% 2010 65%

DRAFT—Preliminary work product

Mesothelioma claims have leveled off at about 1,750 per year

500 1,000 1,500 2,000 2,500 3,000 3,500 1984 1986 1988 1990 1992 1994 1996 1998 2000 2002 2004 2006 2008

Claims Incidence

November 8, 2010 17 Source: Bates White DRAFT—Preliminary work product

In 2000, mesothelioma claims received about $1 million on average

November 8, 2010 18

Item Value Total Costs $50 B Defense-to-indemnity ratio 25% Defense Cost $10 B Indemnity Cost $40 B Mesothelioma share 35% Mesothelioma Indemnity $14 B Pre-2000 resolved mesothelioma claims 15,000 Average value of a mesothelioma claim $900,000

  • FAIR Act proposed a mesothelioma value of $1.1 million

(Plaintiffs’ bar did not object to this value)

slide-7
SLIDE 7

10/19/2010 7

DRAFT—Preliminary work product

Today, mesothelioma claims received no more than $1.5 million on average

  • “Show Me The Money”[1] documents this fact through multiple routes
  • Naming and settlement patterns
  • Disclosed defendant expenditure levels
  • Verdicts
  • Plaintiff law firm profits
  • FAIR Act (2002 to 2005) proposed $1.1 million per mesothelioma claim

November 8, 2010 19 [1] Charles E. Bates and Charles H. Mullin, “Show Me The Money,” MEALEY’S Litigation Report: Asbestos 22, no. 21 (2007) http://www.bateswhite.com/insight.php?NewsID=81 DRAFT—Preliminary work product

Typical settlement pattern for active defendants and claimants

Defendant perspective Percentage Range Average Target Less than 5% More than $250,000 $600,000 Significant risk 15%-20% $50,000 to $250,000 $100,000 Non-core 40% Less than $50,000 $15,000 Dismissed 40% $0 $0

November 8, 2010 20

Claimant perspective Low High Named defendants 20 50 Target 1 1 Significant risk 3 6 Non-core 8 20 Total recovery $1 M $1.5 M

DRAFT—Preliminary work product

Future tort-based expenditure scenarios

Factor Scenario 1 Scenario 2 Scenario 3 Scenario 4 Scenario 5 Mesothelioma value $1,250,000 $1,250,000 $1,250,000 $1,500,000 $1,500,000 Trust impact per claim $500,000 $500,000 $250,000 $250,000 $0 Net tort payment $750,000 $750,000 $1,000,000 $1,250,000 $1,500,000 Mesothelioma claims 25,000 27,500 30,000 30,000 30,000 Mesothelioma indemnity percentage 90% 85% 85% 85% 80% Nominal Indemnity $20.8 B $24.3 B $35.3 B $44.1 B $56.3 B defense-to-indemnity ratio 1-to-2 1-to-1 2-to-3 2-to-3 3-to-4 Nominal Defense $10.4 B $24.3 B $22.9 B $28.7 B $42.2 B Nominal Total $31.3 B $48.5 B $58.2 B $72.8 B $98.4 B

November 8, 2010 21

slide-8
SLIDE 8

10/19/2010 8

DRAFT—Preliminary work product

Verdicts do not equate to average compensation (2001 to 2008)

November 8, 2010 22

Characteristic Mesothelioma Lung Cancer Other Cancer Non-malignant Average value $7.8 M $4.1 M $11.3 M $3.6 M Median Value $4.5 M $1.1 M $3.4 M $1.6 M Count 192 56 5 78

  • Cases taken to verdict are not representative
  • Otherwise, other cancer claims receive the greatest compensation
  • Among mesothelioma cases value is driven by age and law firm
  • Verdicts for claimants under 60 years of age average over $12 million
  • Verdicts for claimants over 60 years of age average under $2 million

DRAFT—Preliminary work product

Average value of mesothelioma verdict awards

November 8, 2010 23

$0 M $5 M $10 M $15 M $20 M $25 M 2000 2001 2002 2003 2004 2005 2006 2007 2008 2009

DRAFT—Preliminary work product

Average value of mesothelioma plaintiff verdict awards

November 8, 2010 24

$0 M $5 M $10 M $15 M $20 M $25 M 2000 2001 2002 2003 2004 2005 2006 2007 2008 2009

slide-9
SLIDE 9

10/19/2010 9

DRAFT—Preliminary work product

Trust payments have grown by multiples in recent years

November 8, 2010 25

$0 B $1 B $2 B $3 B $4 B $5 B 1997 1998 1999 2000 2001 2002 2003 2004 2005 2006 2007 2008 2009 Trust Payments Bankruptcy Payments

DRAFT—Preliminary work product

524(g) trusts assets are sufficient to cover the former tort liability of the reorganized defendants

Era Trust assets Average payment per mesothelioma claim

Historically $4 B $50,000 Today $25 B $1,000,000 Tomorrow $40 B $1,600,000

November 8, 2010 26 DRAFT—Preliminary work product

Implications for reserves

November 8, 2010 27

slide-10
SLIDE 10

10/19/2010 10

DRAFT—Preliminary work product

2010 and forward litigation environment

  • Slow down in large defendant bankruptcy filings
  • Subsequent slow down in trust funding
  • Corresponding slow down in new defendants
  • There will not be another bankruptcy wave akin to 2000-2002
  • Large cash distributions from trusts
  • Eventually more than $1 million per mesothelioma claim on average
  • Net present value of trust assets are sufficient to cover the several

shares of their predecessor companies

November 8, 2010 28 DRAFT—Preliminary work product

A typical profile of “new” tort defendant

?

November 8, 2010 29

Payments dominated by front-line defendants Transfer of liability while litigation is stayed against reorganizing defendants Future asbestos expenditures

DRAFT—Preliminary work product

How will trust payments affect tort defendant payments?

  • CMOs
  • West Virginia (defendants won)
  • Madison County (defendants lost)
  • Legislative efforts
  • GAO investigation of trusts
  • State-level efforts
  • Discovery in individual cases
  • Request for already filed trust claims
  • Request for not yet filed trust claims
  • Request for admissions
  • Expert testimony—Bates White trust-based exposure reports

November 8, 2010 30

slide-11
SLIDE 11

10/19/2010 11

DRAFT—Preliminary work product

New defendants indemnity expenditures are likely to decline substantially faster than mesothelioma incidence

November 8, 2010 31

Payments dominated by front-line defendants Transfer of liability while litigation is stayed against reorganizing defendants Future asbestos expenditures

DRAFT—Preliminary work product

Account-specific IBNR: Scenario-based analysis

  • Define the scenarios
  • Develop a family of future expenditure forecasts
  • Forecast future dates of first exposure
  • Build the policy chart(s)
  • Determine the potential allocation methods
  • Use software to run all combinations of scenarios
  • Can be hundreds or thousands of scenarios
  • Low cost with proper software
  • Analysis of all interactions
  • Specify a probability distribution for each unknown factor
  • Probability distributions yield expected allocated loss to each policy

through time and a distribution about that expectation

November 8, 2010 32 DRAFT—Preliminary work product

Define scenarios and assign probabilities

November 8, 2010 33

Allocation parameters

Expenditure stream Probability Coverage cutoff Probability Low 30% 1982 10% Medium 50% 1985 90% High 20% Trust Impact Probability Allocation Probability 0% 20% Carter-Wallace 50% 25% 50% Pro Rata 50% 50% 30% Occurrences Probability Dofe Probability One 80% Aged Dofe 50% Many 20% Unaged Dofe 50% Product Percentage Probability Discount inputs Value 85% 80% Present value year 2009 98% 20% Discount Rate 5.50%

slide-12
SLIDE 12

10/19/2010 12

DRAFT—Preliminary work product

Distribution of potential outcomes can be highly concentrated

November 8, 2010 34 3.8 60.3 24.7 10.9 0% 10% 20% 30% 40% 50% 60% 70% 0.5M 1.0M 1.5M 2.0M 2.5M 3.0M 3.5M 4.0M 4.5M 5.0M 5.5M 6.0M 6.5M 7.0M 7.5M 8.0M 8.5M 9.0M 9.5M 10.0M DRAFT—Preliminary work product

Distribution of potential outcomes can be very diverse

November 8, 2010 35 38.1 4.6 4.4 0.4 0.4 0.4 4.0 3.7 1.1 27.0 15.9 0% 5% 10% 15% 20% 25% 30% 35% 40% 45% 0.5M 1.0M 1.5M 2.0M 2.5M 3.0M 3.5M 4.0M 4.5M 5.0M 5.5M 6.0M 6.5M 7.0M 7.5M 8.0M 8.5M 9.0M 9.5M 10.0M DRAFT—Preliminary work product

Portfolio reserves

  • Expected loss on a portfolio
  • Individually model each account
  • Typically more cost effective to model a random sample of accounts
  • Variability in the portfolio is not the sum of the accounts
  • Law of large numbers does not apply
  • Distributions will not be normal
  • Systemic risks exist in asbestos litigation

November 8, 2010 36

slide-13
SLIDE 13

10/19/2010 13

DRAFT—Preliminary work product

Modeling systemic risks to obtain robust reserves

  • Systemic risks
  • Future incidence of mesothelioma
  • Propensity to sue (PTS)
  • Changes in the litigation environment
  • Interaction between trust payments and tort losses
  • Rogue venues
  • State-specific allocation law
  • Simulation model of all sampled accounts
  • Low cost if scenario model is already done
  • Captures the systemic risk
  • Defines the distribution of potential outcomes
  • New accounts are positively correlated with adverse develops

November 8, 2010 37 DRAFT—Preliminary work product

Charles Mullin, PhD

Charles H. Mullin is a recognized expert on asbestos-related matters. He provides advice and expert analysis on asbestos liability issues involving insurance coverage, reinsurance, bankruptcies, and due diligence for mergers, acquisitions, and spin-offs. Dr. Mullin has authored numerous expert reports and provided expert testimony in asbestos-related insurance matters, as well as provided due diligence reports for corporate transactions. He has designed and implemented statistically reliable claim file reviews both for asbestos defendants and for insurance companies. In addition to Dr. Mullin’s retentions as an expert, he regularly publishes articles on asbestos and insurance allocation topics. He also is frequently invited to speak at industry conferences on these topics. Prior to joining Bates White, Dr. Mullin taught courses in advanced statistical economic analysis and labor economics while on the faculty in the Department of Economics at Vanderbilt University and at the University of California at Los Angeles. He published papers on applied and theoretical econometrics and labor economics in peer-reviewed journals with a focus on robust estimation techniques. Prior to his academic career, Dr. Mullin worked for Quantum Consulting conducting demand-side management for utility companies. This work included intensive data analysis and micro-simulation modeling.

  • Dr. Mullin received his PhD in economics from the University of Chicago and his BA in economics

and mathematics from the University of California at Berkeley. Dr. Mullin specializes in statistical analysis and economic modeling. He has more than 15 years of experience providing this expertise in both the private and public sectors.

November 8, 2010 38

(202) 747-2084 charlie.mullin@bateswhite.com

DRAFT—Preliminary work product

Impact of Current Tort Environment on Asbestos Reserves

CAS 2010 Annual Meeting

November 8, 2010 Charlie Mullin