SLIDE 1 1
MANAGEMENT OF CARDIOVASCULAR RISK
IN DIABETES
Have we turned the corner?
Binh An P. Phan, MD Associate Professor of Medicine Division of Cardiology San Francisco General Hospital University of California, San Francisco
33rd Annual Advances in Heart Disease December 16, 2016
Disclosures: none
Outline
- Review the cardiovascular risk associated with diabetes
- Discuss current medical therapies and optimal approach to
reducing CVD risk in patients with diabetes
- Introduce newer diabetes medications and their potential
impact on improving residual CVD risk
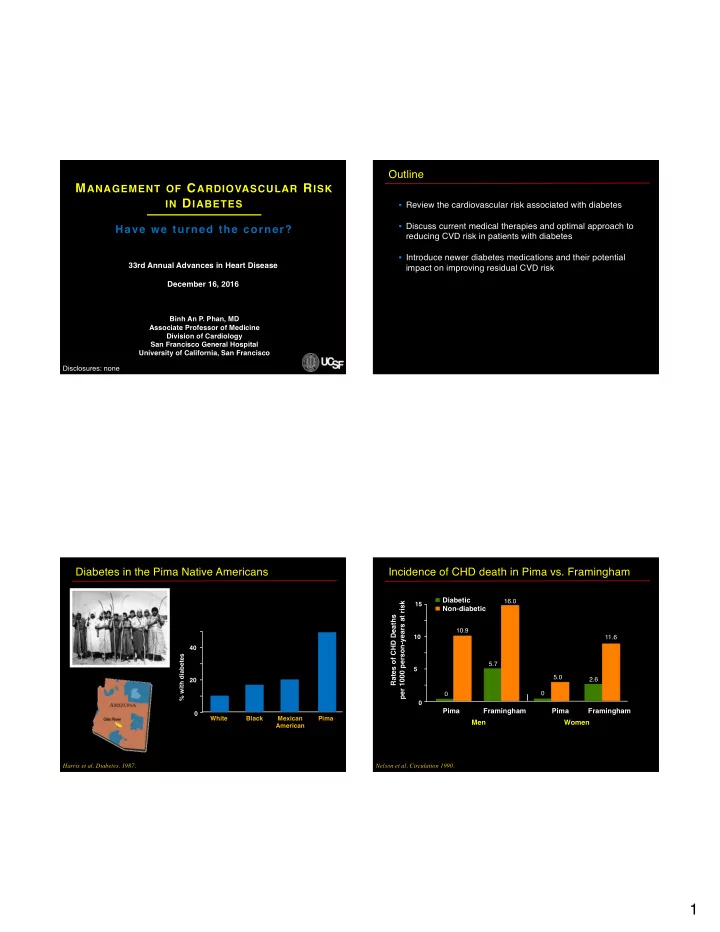
Diabetes in the Pima Native Americans
% with diabetes White Black Mexican American Pima 20 40 Harris et al. Diabetes. 1987.
Incidence of CHD death in Pima vs. Framingham
Rates of CHD Deaths per 1000 person-years at risk
15
Diabetic Non-diabetic Pima Framingham Pima Framingham Men Women
5 10 Nelson et al. Circulation 1990. 11.6 2.6 16.0 5.7 10.9 5.0
SLIDE 2
2
What is the CVD risk associated with diabetes?
Diabetes CVD
MRFIT: CV risk associated with diabetes
Age-adjusted CV death rate per 10,000 pt-years None 1 only 2 only All 3 Number of CV risk factors (cholesterol > 200mg/dL, smoking, SBP > 120 mmHg)
Stamler et al. Diabetes Care 1993.
7 Non-diabetic Diabetic 30 13 58 24 90 48 126 N=347,978 Avg f/u 12 yrs
East West Study: diabetes as CV equivalent to CAD
7-year Incidence of MI (%)
no MI + MI No MI +MI
Haffner et al. NEJM 1998.
3.5% 18.8% 20.2% 45.0%
Non-diabetic, n=1373 Diabetic, n=1059
British Heart Study: diabetes duration and CHD risk
Wannamethee et al. Arch Intern Med 2011.
No DM or MI (n=3197) DM with no MI MI with no DM (n=358) Late onset (n=307) Early onset (n=107) CVD Rate per 1,000 person-yrs 13.5 22.7 28.5 34.5 Age- adjusted HR (95% CI) 1 (ref) 1.59 (1.19-2.12) 2.61 (1.73-3.96) 2.35 (1.88-2.95) Early onset: dx < 60 yrs-old, avg diabetes duration 16.7 yrs Late onset: dx ≥ 60 yrs-old; avg diabetes duration 4.9 yrs
SLIDE 3 3
Event rate per 1,000 patient years 0-1 2-7 ≥ 8 Duration of diabetes, years 20.3 CVD events All-cause mortality 38.0 19.7 44.4 36.6 66.9
60 40 20
British Heart Study: diabetes duration and CHD risk
Wannamethee et al. Arch Intern Med 2011.
10-year incidence of CHD (%) Non-fatal CHD Fatal CHD
60 40 20
Strong Heart Study: risk factors and CHD risk in DM
Howard et al. Diabetes Care 2006. ND DM 1-2 RF DM 3-4 RF DM 5-6 RF DM 7-9 RF ND DM
No prior CHD CHD
RF: sex, LDL >100 mg/dl, albuminuria (>300 mg/g creatinine), HTN, HDL <40 mg/dl, TG >150 mg/dl, smoking, fibrinogen >352 mg/dl, and DM>20 years. ND=non-diabetic DM=diabetes mellitus
Fasting blood glucose CVD Risk HR (95% CI)
Known diabetes > 132 mg/dl 2.36 (2.02-2.76) < 132 mg/dl 1.61 (1.42-1.82) No known diabetes > 132 mg/dl 1.78 (1.56-2.03) 109.8-132 mg/dl 1.17 (1.08-1.26) 100.8-109.7 mg/dl 1.11 (1.04-1.18) 70.2-100.7 mg/dl 1.00 (0.95-1.06) <70.2 mg/dl 1.07 (0.97-1.18)
Relationship of fasting blood glucose and CV risk
Emerging Risk Factors Collaboration. Lancet 2010.
0.8 1 2 4
Study No. RR for CHD per 1% HbA1c higher
EPIC-Norfolk 529 Rancho Bernardo 329 Wang et al. 241 ARIC 235 CHS 96 FOS 76 BWHHS 60 NWAHS 42 AUSDiab 31 Overall 1639
Relationship of HbA1c and CV risk without DM
Sarwar et al. Plos Med 2010.
0.5 0.75 1 1.5 2
1.20 (1.10-1.31)
SLIDE 4
4
CV risk from blood glucose, cholesterol, and SBP
Emerging Risk Factors Collaboration. Lancet 2010. 4.0 3.0 2.0 1.0
HR (95% CI) Mean fasting blood glucose (mg/dl) Mean cholesterol (mg/dl) Mean systolic blood pressure (mmHg) 70 110 150 100 190 260 120 140 160
Impact of DM duration and risk factors on CHD risk
CHD risk Age CHD equivalence threshold DM diagnosis 10 years DM duration Additive CHD risk based on DM duration and risk factors
How do you lower CVD risk associated with diabetes?
Diabetes CVD
Duration HTN Lipids Smoking
UKPDS: Intensive glucose lowering on risk reduction
UK Prospective Diabetes Study Group. Lancet 1998.
Microvascular disease Risk Reduction (%) Retinopathy Albuminuria MI 25% 21% 33% 16% p=0.015 p=0.01 p<0.001 p=0.052 Mortality 6% p=0.44
Mean achieved A1c: 7.0% (Intensive rx) vs. 7.9% (conventional rx)
SLIDE 5 5
UKPDS post-study: 10 year follow up, legacy effect
Holman et al. NEJM 2008.
Microvascular disease Risk Reduction (%) MI 24% 15% p=0.001 P=0.014 Mortality 13% P=0.007 Median HbA1c % 1977 1997 2007
Conventional Intensive Follow-up
9 8 7 6
DCCT follow-up: long term intensive glucose control
DCCT/EDIC Research Group. NEJM 2005.
DCCT Trial EDIC observation
Mean achieved A1c: 7.0% (Intensive rx) vs. 9% (conventional rx)
Trial OR (95% CI)
HbA1c Standard Intensive UKPDS 7.9% 7.0% 0.75 (0.54-1.04) PROactive 7.6% 7.0% 0.81 (0.65-1.00) ADVANCE 7.0% 6.4% 0.92 (0.78-1.07) VADT 8.4% 6.9% 0.85 (0.62-1.17) ACCORD 7.5% 6.4% 0.82 (0.68-0.99) Overall 0.85 (0.77-0.93)
Meta-analysis of intensive glucose rx on CHD events
Kausik et al. Lancet 2009. 0.6 0.8 1
Intensive rx better Standard rx better
Lowering HbA1c by 0.9% associated with 15% RR reduction in CHD events.
Syst-Eur: HTN rx reduces CV events in diabetes
Tuomilehto et al. NEJM 1999.
Reduction in Event Rate for Active Rx (%)
Overall mortality CVD mortality All CV events Fatal, non- fatal CVA Fatal, non- fatal CVD events
Diabetic, n=492 Non-diabetic 41% 8% 16% 25% 36% 22% 70% 62% 69% 57%
SLIDE 6 6
1
Benefit of intensive LDL-C lowering in diabetes
Sheperd et al. Diabetes Care 2005. Sever et al. Diabetes Care 2005. HPS. Lancet 2003.
Difference in LDL-C (mg/dL) Aggressive lipid-lowering better Aggressive lipid-lowering worse 0.026 0.036 0.001 <0.0001 0.0003 Primary event rate (%) 17.9 11.9 9.0 12.6 13.5 Control 13.8 9.2 5.8 9.4 9.3 Treatment 0.63 0.67 0.73 P TNT Diabetes, CHD ASCOT-LLA Diabetes, HTN CARDS Diabetes, no CVD HPS All diabetes Diabetes, no CVD
CV relative risk
0.7 0.9 0.5 1.7 0.77 22* 35† 46† 39† 39† 0.75 *Atorvastatin 10 vs 80 mg/day
†Statin vs placebo
CV benefits of different interventions in diabetics
Sattar et al. Diabetologia 2013.
Per 4 mmHg lower SBP
CV events prevented per 200 DM patients treated for 5 yrs
Per 1 mmo/L lower LDL-C Per 0.9% lower HbA1C
Steno-2: Multi-factorial intensive rx in diabetes
Gaede et al. NEJM 2003. Primary composite
(%) 60 50 40 30 20 10 53% RRR P = 0.01 Follow-up (months) Conventional N = 80 Intensive 12 24 36 48 60 72 84 96 *CV death, MI, stroke, CABG/PCI, amputation, PAD surgery N = 80
- BP < 130/80
- A1c < 6.5%
- TC < 175 mg/dL
- TG < 150 mg/dL
Intensive Rx
Diabetes drug development
DeFronzo et al. Curr Med Res Opin 2008.
1920 1960 1970 1980 1990 2000 2010 Insulin Sulfonylurea Metformin Alpha glucosidase inhibitor Rapid-acting insulin Basal insulin TZD GLP-1 agonists DPP-4 inhibitors SGLT2 inhibitors FDA requires CV outcomes data
SLIDE 7 7
Mechanisms of action of traditional diabetes drugs
Krentz et al. Drugs 2005. α-Glucosidase inhibitors Intestine: ↓glucose absorption Biguanides Liver: ↓hepatic glucose output ↑glucose uptake Blood glucose Sulfonylureas Pancreas: ↑insulin secretion Muscle and adipose tissue: ↓insulin resistance ↑glucose uptake Thiazolidinediones (TZD)
Actions of GLP-1 agonists and SGLT-2 inhibitors
DeFronzo et al. Curr Med Res Opin 2008.
Action GLP-1 agonist SGLT-2 inhibitor Primary mechanism Stimulates insulin secretion, inhibits glucagon secretion, decreases glucose production, increase insulin sensitivity Inhibits sodium–glucose cotransporter 2 (SGLT2) inhibitor, which prevents renal glucose resorption Cardiovascular Increase cardiac contractility and cardiac output Lowers blood pressure by inhibiting sodium reabsorption Metabolic Causes weight loss through suppression of appetite and reduced gastric emptying Induces weight loss from altered energy balance with glucose wasting GLP-1: glucagon-like protein-1, SGLT-2: sodium-glucose co-transporter-2
LEADER trial: GLP-1 in high CVD risk diabetics
Marso et al. NEJM 2016.
9,340 diabetics at high ASCVD risk
- > 50 yo with ASCVD, CKD, HF
- ≥ 60 yo with +1 CVD risk factor
Liraglutide Placebo Median-follow-up 3.8 years Primary endpoint: first occurence of CV death, non-fatal MI, non-fatal CVA
LEADER trial: GLP-1 in high CVD risk diabetics
Marso et al. NEJM 2016.
Baseline Liraglutide (N=4,668) Placebo (N=4,672) Male sex 3011 (64.5) 2992 (64.0) Age, yrs 64.2 ± 7.2 64.4 ± 7.2 Diabetes duration, yrs 12.8 ± 8.0 12.9 ± 8.1 HbA1c, % 8.7 ± 1.6 8.7 ± 1.5 Established CVD (age>50) 3831 (82.1) 3767 (80.6) CVD risk factors (age≥60) 837 (17.9) 905 (19.4)
SLIDE 8
8
LEADER trial: GLP-1 in high CVD risk diabetics
Marso et al. NEJM 2016.
Liraglutide Placebo Hazard Ratio P Value Outcome Patients (%) Patients (%) Primary outcome 608 (13.0) 694 (14.9) 0.87 (0.78-0.97) 0.01 CV death 219 (4.7) 278 (6.0) 0.78 (0.66-0.93) 0.007 MI 292 (6.3) 339 (7.3) 0.86 (0.73-1.00) 0.046 Weight loss was 2.3 kg more, SBP was 1.2 mmHg lower, and HR was 3.0 beats/min higher in the liraglutide group.
EMPA-REG: SGLT-2 inhibition in diabetics with CVD
Zinman et al. NEJM 2015.
7020 diabetics with established ASCVD
Ave age 63 yo, 72% male, 72% white, 75% CAD, 57% DM > 10 yrs
Empagliflozin 10 or 25 mg daily Placebo Median-follow-up 3.1 years Primary endpoint: CV death, non-fatal MI, non-fatal CVA
EMP-REG: SGLT-2 inhibition in diabetics with CVD
Zinman et al. NEJM 2015.
Empagliflozin Placebo Hazard Ratio P Value Outcome Patients (%) Patients (%) Primary outcome 490 (10.5) 282(12.1) 0.86 (0.74-0.99) 0.04 CV death 172 (3.7) 137 (5.9) 0.62 (0.49-0.77) <0.001 HF hospitalization 126 (2.7) 95 (4.1) 0.65 (0.50-0.85) 0.002
NHANES: CV mortality in diabetic men and women
Gregg et al. Annals Int Med 2007.
CVD mortality rate
30 20 10
Cohort Follow-up Men
1971- 1986 1976- 1992 1988- 2000 1971- 1986 1976- 1992 1988- 2000
Women Non-diabetic Diabetic
SLIDE 9 9
How do you lower residual CVD risk associated with diabetes?
Diabetes CVD
Duration HTN Lipids Smoking Long term intensive glucose control BP control High intensity statin Smoking cessation Novel diabetes related therapies
Prevalence of diabetes in Pima populations
Percent (age-adjusted prevalence)
60 30
Men Women Non-Pima Mexicans Mexican Pima US Pima
10 20 40 50 Schulz et al. Dia Care 2006. 40.8% 34.2% 8.5% 5.6% 5.0% 0%
Risk factor differences in Pima populations
US Pima Mexican Pima Mexicans Lipid intake (%) BMI (kg/m2) 36.3 26.3 27 Physical activity (hr/wk) 7 27 25.8 BMI (kg/m2) 34.6 25.1 25.6 DM prevalence (%) 38.1 7.1 2.6
Schulz et al. Dia Care 2006.
DPP: Impact of lifestyle intervention in incident DM
10 20 30 40 0.5 1.0 1.5 2.0 2.5 3.0 3.5 4.0
Year N = 3234, no diabetes Age 50 207 lbs Glucose 107
- Lose 5–10 lbs
- Exercise 2.5 hrs/wk
Placebo Metformin Lifestyle
Cumulative incidence of diabetes (%)
¯31% ¯58%
P < 0.001 < 0.001 Diabetes Prevention Program Research Group. NEJM 2002.
SLIDE 10
10
NHANES: Trends in CVD risk factor control in DM
Wong et al. Diab Vasc Dis Res. 2013
Percentage of patients at goals for individual risk factors (%)
1999-2000 2001-2002 2003-2004 2005-2006 2007-2008 2009-2010
HbA1c < 7% 35.0 49.6 56.9 57.5 54.1 55.5 BP < 130/80 34.2 42.3 49.5 42.2 49.1 52.8 LDL-C <100 37.0 38.4 38.5 54.5 61.0 54.4 BMI < 25 14.1 17.6 16.1 11.1 13.7 10.3
24% were at goal for all three factors of HbA1c, BP, and LDL-C in 2009-2010
Life-long strategy to reduce CVD risk in diabetes
CHD risk CHD equivalence threshold Delay DM diagnosis Intensive rx of DM and CVD risk factors Optimize baseline CVD risk DM diagnosis
Have we turned the corner on CVD risk management for diabetes ?
CVD
Duration HTN Lipids Smoking Long term intensive glucose control BP control High intensity statin Smoking cessation Novel diabetes related therapies Life-long intensive lifestyle intervention
Diabetes
Population wide optimization of CVD risk factors
We have come a long way. We have a long way to go. Thank you.