
1
Beyond crisis -J.J. Boillot 1
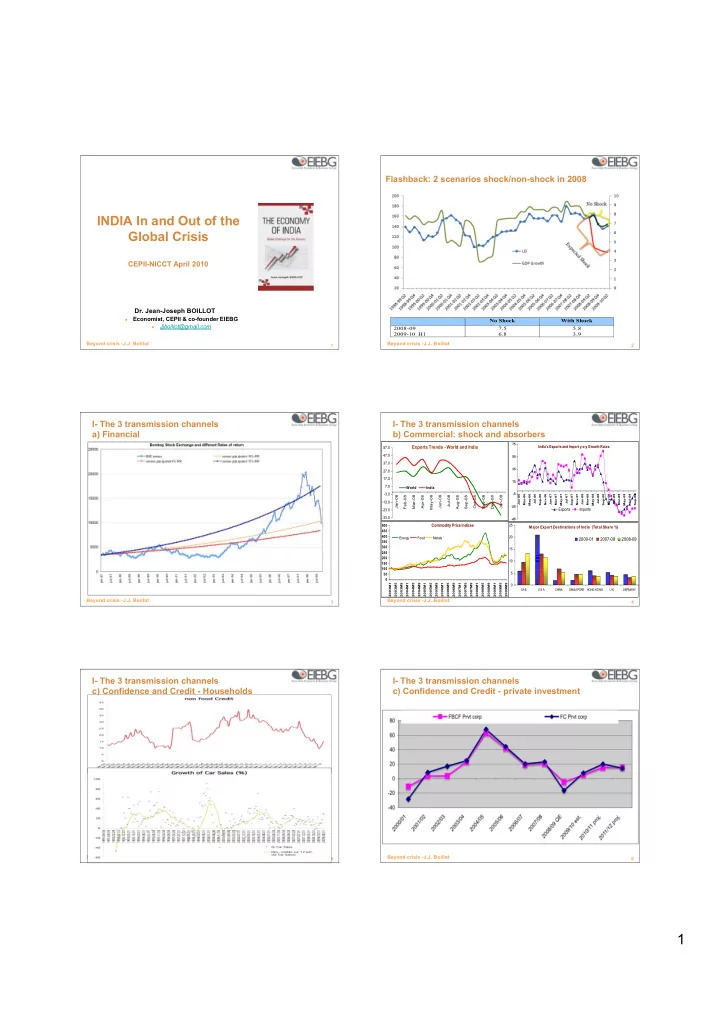
INDIA In and Out of the Global Crisis
CEPII-NICCT April 2010
- Dr. Jean-Joseph BOILLOT
Economist, CEPII & co-founder EIEBG
Jjboillot@gmail.com
Beyond crisis -J.J. Boillot 2
Flashback: 2 scenarios shock/non-shock in 2008
No Shock With Shock 2008-09 2009-10 H1 7.5 6.8 5.8 3.9
Beyond crisis -J.J. Boillot 3
I- The 3 transmission channels a) Financial
Beyond crisis -J.J. Boillot 4
I- The 3 transmission channels b) Commercial: shock and absorbers
Exports Trends - World and India
- 33.0
- 23.0
- 13.0
- 3.0
7.0 17.0 27.0 37.0 47.0 57.0 Jan-08 Feb-08 Mar-08 Apr-08 May-08 Jun-08 Jul-08 Aug-08 Sep-08 Oct-08 Nov-08 Dec-08 Jan-09 World India Commodity Price Indices 50 100 150 200 250 300 350 400 450 500 2003M1 2003M5 2003M9 2004M1 2004M5 2004M9 2005M1 2005M5 2005M9 2006M1 2006M5 2006M9 2007M1 2007M5 2007M9 2008M1 2008M5 2008M9 2009M1 2009M5 2009M9 Energy Food Metals India's Exports and Import y-o-y Growth Rates
- 45
- 25
- 5
15 35 55 75 Jan-06 Mar-06 May-06 Jul-06 Sep-06 Nov-06 Jan-07 Mar-07 May-07 Jul-07 Sep-07 Nov-07 Jan-08 Mar-08 May-08 Jul-08 Sep-08 Nov-08 Jan-09 Mar-09 May-09 Jul-09 Sep-09
Exports Imports Major Export Destinations of India (Total Share % ) 5 10 15 20 25
UAE U S A CHINA SINGAPORE HONG KONG U K GERMANY
2000-01 2007-08 2008-09 Beyond crisis -J.J. Boillot 5
I- The 3 transmission channels c) Confidence and Credit - Households
Beyond crisis -J.J. Boillot 6