1 Introduction Over the past decades, population ageing has been one - - PDF document

1 introduction over the past decades population ageing
SMART_READER_LITE
LIVE PREVIEW

1 Introduction Over the past decades, population ageing has been one - - PDF document

Investigating socio-economic explanations for gender and cross-national inequalities in self-reported health among the elderly in contemporary welfare countries Nicholas Kofi Adjei*, Tilman Brand*, Hajo Zeeb* *Leibniz Institute for Prevention


slide-1
SLIDE 1

1

Investigating socio-economic explanations for gender and cross-national inequalities in self-reported health among the elderly in contemporary welfare countries Nicholas Kofi Adjei*, Tilman Brand*, Hajo Zeeb* *Leibniz Institute for Prevention Research and Epidemiology (BIPS), Germany

Corresponding Author: Nicholas Kofi Adjei (adjei@bips.uni-bremen.de)

December 13, 2016. Abstract The objective of this study was to explain gender and cross-national inequalities in self-reported health among the elderly by taking into account time use activities. Data from the Multinational Time Use Study (MTUS) on 13,223 men and 18,192 women from Germany, Italy, Spain, UK and the US were analyzed using the Blinder-Oaxaca decomposition method to identify the relative contribution of different factors to total gender inequality in health. We found significant gender differences in health in Germany, Italy and Spain, but not in the other

  • countries. The decomposition showed that differences in time allocated to active leisure and

level of educational attainment accounted for the largest health gap. The results of our study demonstrate the need of using an integrated framework of social factors in analyzing and explaining the gender and cross-national differences in health among the elderly.

slide-2
SLIDE 2

2

Introduction

Over the past decades, population ageing has been one of the major global demographic processes [1-3]. The percentage of those aged 60 years and above increased from 8% in 1950 to 12% in 2013 and it is projected to increase to 21% by 2050 [4]. Empirical research shows that women have a longer life expectancy than men [5-7]. In 2013, Statistics from the United Nations indicated that 85 men per 100 women were 60 years or over and 61 men per 100 women were 80 years or over [4]. Although women live longer than the men, they report poorer health [8], as well as more physical limitation [9] and chronic conditions [10]. Inequalities in socio-economic position (SEP) contribute to differences in health between older men and women [11-14]. However, there is still no consensus about the best indicators of socio- economic position to be used among the elderly [13,15-17]. Thus, there is a need to further explore the suitability of reliable SEP measures among older men and women. Apart from socio-economic position, social roles and activities may explain gender differences in health. Since gender is perceived to be a distinct feature with respect to social roles, some studies have examined the differences in time spent on role-related activities among men and women [18,19]. Although these studies suggest that men have increased the amount of time allocated to some role-related activities such housework, their contribution to these activities remains lower than the women’s. Coltrane [19] showed that women spend two or three times more time doing routine repetitive housework than men. Even after retirement, gender roles are still shaped in a traditional way in some welfare countries, especially in the Southern European countries, where women continue to assume the role of housewife [1]. This unequal distribution

  • f household activities limits women’s participation in active leisure and other social activities

[20], which have a negative effect on their health [21]. However, the extent of gender and cross-national differences in the distribution of time regarding role related activities varies by social norms and national policies [22,23]. These mediating factors have also been identified as potential contributing factors to health inequality. For example, [24] found that 10 percent of differences in self-reported health could be linked with welfare states characteristics. Thus, policies and social norms may affect the allocation of time by influencing the patterns of daily activities, either increasing or decreasing the cost and time devoted to role-related activities.

slide-3
SLIDE 3

3

Several studies have explored the relationship between social roles and health [25-27], but only some have focused on this topic among the elderly [28,29]. However, the conceptual framework used by these studies on the elderly was related to “role occupancy”, such as parental status (i.e., the presence of children in the household) and marital status (i.e., being married, divorced, separated or widowed), and their associations with health. These measures of social roles are “crude and indirect” and might give little information on how much time and effort is spent on role-related activities such as housework, childcare and other household activities [30]. In this study, we operationalized social roles as time allocation to the various role-related activities among older men and women based on Bird and Fremont [30]. Time use data was used to examine the extent to which the “role occupant” fulfils the role. The amount of time spent on role related activities such as household work, childcare, maintenance, voluntary work and other activities was estimated using Diary-based time allocation data. Diary-based time allocation data has been shown to be more reliable, accurate and providing a better picture on how social roles influence health as compared to “stylized estimates” [30]. So far, only four studies have examined the relationship between time allocation and health [30- 33]. However, time allocated to differing social roles has yet to be examined as an explanation for the observed gender differences in health among the elderly. The objective of this study is to explain gender inequalities in self-reported health among the elderly by taking time use activities, socio-economic positions, family characteristics and cross-national differences into account. METHODS Data We used data from the Multinational Time Use study (MTUS, version W53).The MTUS data is a large cross-national, harmonized and comparative time-use database from 38 countries across six waves. This data collection has been organized by the Centre for Time Use Research, located in the Department of Sociology at the University of Oxford. The data set contains information on the socio-economic and demographic background of the respective diarist and the total time spent on 41 activities over a 24-hour period [34]. For the purpose of this study, we limited our sample set to respondents who were 65 years and above at the time of the study. The minimum age has been chosen based on the retirement age in most EU countries [see 35]. The countries included in this analysis are United Kingdom (survey year, 2000); United States

slide-4
SLIDE 4

4

(survey year, 2003); Spain (survey year, 2002); Italy (survey year, 2002); and Germany (survey year, 2001). Health outcome The study used self-reported health as a measure of health status (“How is your health in general; would you say that it is ….?” response options: zero (poor) to three (very good)). We created a dichotomous outcome as in [36], where good health took a value of “0” if the respondent reported “very good” or “good” health and a value of “1” if they reported “poor” or “fair” health. It has been shown that self-assessed health is an inclusive and accurate measure

  • f health status [37] and a good predictor of mortality among the elderly, even exceeding

physicians’ assessments [38]. Time use All time use variables were measured in hours per day. We limited our study to respondents who reported all 1440 minutes (24 hours) of activities during the day in the diary, and hence adopted the broad categories suggested earlier by [1]. Table S1 (appendix) lists the detailed activities included in the following 5 broad categories.  Paid work (e.g. paid work, travel to and from work)  Housework (e.g. cooking, washing, gardening, shopping)  Active leisure Activities (e.g. walking, volunteer, sports, travel for pleasure)  Personal activities (e.g. sleep, eating, bathing, dressing, medical care)  Passive leisure activities (e.g. watching television, relaxing) Socio-economic position and family characteristics Socio-economic positions were measured by three indicators: Education, wealth and employment status. Education was categorized into three groups: less than secondary education, completed secondary education and above secondary education. Housing tenure (owner

  • ccupier vs. renting) and car ownership (no car, one car and two or more cars) were the two

indicators used to measure wealth. Employment status in two categories was included in the model to examine the effect of paid employment at older ages. Family characteristics were measured by household size categorized into three groups: single person household, two persons household, and three or more persons household.

slide-5
SLIDE 5

5

Analytical Strategy Two separate analytical strategies were followed. First, we applied binary logistic regressions to examine the association between time use, social factors and self-reported health

  • simultaneously. Estimates in the model were derived from hierarchical modelling of self-

reported health in which the variables were added in three steps. Model 1 includes only time use activities, that is, time spent on paid work, housework, active leisure, passive leisure and personal activities. In step two (model 2), we added socio-economic position and family

  • characteristics. Finally, we introduced welfare countries (model 3).

The binary logit model estimated the probability of the dependent variable (self-reported health) to be 1 (Y=1), which is expressed mathematically as follows: ) exp( 1 ) exp( ) | 1 (   x x x Y pr   

(1)

We then applied a decomposition method to identify the relative contribution of the different factors to total gender inequality in health. We used an extension of the Blinder Oaxaca decomposition method proposed by Yun [39] for non-linear models to examine the contribution

  • f social factors to female excess in the probability of reporting poor health. The decomposition

for a non-linear equation such as 𝑞𝑠(𝑍 = 1) = Φ(Xβ) can be expressed as:

   

) ( ) ( ) ( ) (

1 1 w w m w K i i i m w m m K i i i X w m

X X W X X W Y Y    

        

 

     

(2)

𝑥ℎ𝑓𝑠𝑓 Φ is a standard normal cumulative distribution function, 𝑍 = health status; β = regression coefficient; X= covariates; 𝑛 = men; 𝑥 = women; 𝑋= weight assigned to each covariate that is equal to its proportional contribution to the total endowment or coefficient effect. This decomposition method allows to partition the health differences between men and women into two components, with men as the reference group [40]. The first component is the “the endowment effect” which represents the part of the gender gap in health that is due to differences in group characteristics. The second component is the “coefficient effect” which represents the part due to differences in the group processes. Following Williams [41], we focused on the part of the gap that is due to differences in group characteristics, with decomposition estimates showing how characteristics contribute individually to the health gap. The contributions of the included factors to the health gap can be positive or negative [42].

slide-6
SLIDE 6

6

Using a counterfactual framework, a positive number indicates a reduction in female excess that would have occurred if women had men’s characteristics. All statistical analyses were performed in STATA version 14 [43]. RESULTS Logistic regression Table 1 show the results of multivariate logistic regression hierarchical models that examined the association between social factors and poor self-reported health. [Insert Table 1 about here] The models shows that all time use activities were related to health in the crude and the fully adjusted model. Elderly people who spent more than 1 hour on paid work activities had lower

  • dds of reporting poor health (OR = 0.75; 95% CI=0.63-0.90) as compared to those who spent

less than 1 hour to these activities. Individuals who spent more than 6 hours per day to house work activities had lower odds (OR = 0.65; 95% CI=0.60-0.71) of reporting poor health compared to those who spent less than 4 hours to these activities. We also observed a strong association between poor health and time devoted to active leisure activities. Individuals who devoted more than 4 hours per day to active leisure activities were less likely to report poor health (OR = 0.53; 95% CI=0.49-0.58) as compared to those who devoted less than 2 hours per day to these activities. Passive leisure and personal activity (including sleep hours) were associated with higher odds for poor health. Individuals who spent more than 5 hours on passive leisure activities were more likely to report poor health (OR = 1.31; 95% CI=1.21-1.42) compared to those who devoted less than 3 hours to these activities. The odds of reporting poor health was significantly higher (OR = 1.43; 95% CI=1.31-1.56) for individuals who spent more than 12 hours per day on personal activities compared to those who spent less than 10 hours. In terms of the other factors, many patterns were similar to results from other reports. Women were more likely to report poor health than men (OR = 1.32; 95% CI=1.25-1.40). Educational attainment was significantly associated with health status. We found a negative gradient with the prevalence of poor health increasing with decreasing educational level. Thus, individuals who completed tertiary and above education had the lowest odds of reporting poor health as

slide-7
SLIDE 7

7

compared to those who have not completed secondary education or less (OR = 0.47; 95% CI=0.43-0.51). Odds of reporting poor health increased with age. People who were 80 years and above were more likely to report poor health than those between 65 to 69 years old (OR = 1.44; 95% CI=1.33-1.55). Furthermore, the odds of reporting poor health status was lower among homeowners than renters (OR = 0.80; 95% CI=0.75-0.86). Although the majority of the elderly above 65 years are no longer in the workforce, we observed that those who were currently in paid employment were less likely to report poor health as compared to their counterparts who are not working for pay (OR = 0.52; 95% CI=0.45-0.59). Surprisingly, larger household size was positively associated with poor health status in model 2, but this association disappeared in model 3. We found large cross-national differences in the likelihood of reporting poor health. We can group the countries into two categories, using Germany as reference: Italy and Spain, where elderly people had higher odds of reporting poor health (OR = 2.85; 95% CI=2.59-3.14 and OR = 1.19; 95% CI=1.09-1.31), and UK and the US, where elderly people had lower odds of reporting poor health (OR = 0.68; 95% CI=0.61-0.76 and OR = 0.47; 95% CI=0.43-0.52). Non-linear decomposition Table 2 gives the results of the country specific non-linear decomposition of female excess in the probability of reporting poor health. As discussed in the method section, we focused on the part of inequality due to differences in group characteristics (by variables) and the overall inequality due to differences in group processes.

[Insert Table 2 about here]

In absolute terms, Germany reported the lowest and Italy the highest predicted probability in poor health. In contrast, Germany reported the highest female excess (0.140) in the probability

  • f reporting poor health followed by Italy (0.096) and Spain (0.089), while no female excess

was found in the UK and the US. Italy reported the highest total gender gap (approximately 47%) attributed to differences in group characteristics, followed by Spain (approximately 30%) and Germany (approximately 27%). The two largest contributing factors to this component of gender inequality in health among elderly people across all countries are education and active leisure. If women were to allocate the same time to active leisure activities as men, the female excess in the probability

slide-8
SLIDE 8

8

  • f reporting poor health would be reduced by approximately 18% in Spain and approximately

13% in Italy. In Germany, education is the largest contributor to the part of the inequality deriving from differences in group characteristics. The gender gap would be reduced by approximately 12% if women had the same educational attainment as men. Passive leisure contributed negatively to this part of inequality in all countries, and personal activities showed mixed contributions in different countries. DISCUSSION As far as we know, this is the first study to analyze simultaneously the relationship between time use activities, socio economic position, household characteristics and health among elderly men and women in four European countries and the US. Our study also examined gender and cross-country gaps in patterns of time use among the elderly. All time use activities were related to health with paid work, housework and active leisure activities positively and passive leisure and personal activities negatively associated with health. We found gender differences in health, but these differences vary visibly across countries with no gender gap in health observable in the UK and the US. Decomposing the gap in health, the study showed that differences in time allocated to active leisure and level of educational attainment accounted for the largest share of the health gap. Our findings therefore provide evidence of the relationship between social roles (time allocated to role related activities) and health among the elderly in a gender-specific and country- comparative context. We have compared data from Germany, Spain, Italy, UK and the US. These countries represent different institutional settings and differ with respect to national policies and social norms [22]. National policies have been shown to have a significant effect

  • n health [44]. Therefore, gender and cross-national variations in health may be explained to

some extent by national context and social norms. This complex relationship between the state and family may increase or decrease cost and time in terms of social support, provision of care services and leisure opportunities. As a consequence, men and women may display different time allocation patterns in response to the existing national policies. In the specific case of our comparative analysis, we found that cross-national variations in the provision of public policies may explain to some extent the differences in the patterns of time use among elderly men and

  • women. Furthermore, cultural norms may also shape the relationship between time use

allocation decision and health as found in the southern European countries [22], where gender roles are still shaped in a more traditional way. As a result, women devote more time to

slide-9
SLIDE 9

9

  • housework. This time inflexible routine housework activities limits opportunities for engaging

in other social and leisure activities for women [20], which affects their health negatively. In

  • ur decomposition analysis, we found that the share of health inequality that is explained by

active leisure is more than the share due to socioeconomic position in Italy and Spain. Therefore the results of this study demonstrate the importance of taking into account time spent in social roles in the analysis of gender differences in health among the elderly. There are few limitations of this study that may reduce the generalizability of our findings. First, the cross-sectional design of this study prevents us to conclude any causal association. Because the association between time use activities and health may be reciprocal, conclusions such as “older people allocate less time to certain time use activities due to poor health” (and vice versa) cannot be drawn. Another possible limitation is that only primary activities were considered in the analysis due to data limitations, although it has been shown that performing secondary activities like care activities and watching television simultaneously with primary activities may provide some detailed information of time use. Despite these limitations, this study provides a first overview of time use activities and their relationship with health using a large-scale and comparative set of time use data across Europe and the US of the elderly population.

slide-10
SLIDE 10

10

References

  • 1. Gauthier AH, Smeeding TM (2003) Time Use at Older Ages Cross-National Differences. Research on

Aging 25: 247-274.

  • 2. Kowal P, Kahn K, Ng N, Naidoo N, Abdullah S, et al. (2010) Ageing and adult health status in eight

lower-income countries: the INDEPTH WHO-SAGE collaboration. Global Health Action 3.

  • 3. Rueda S, Artazcoz L, Navarro V (2008) Health inequalities among the elderly in western Europe.

Journal of Epidemiology and Community Health 62: 492-498.

  • 4. United Nations (2013) World Population Ageing 2013 ST/ESA/SERA/348.
  • 5. Austad SN (2006) Why women live longer than men: sex differences in longevity. Gender medicine

3: 79-92.

  • 6. Eskes T, Haanen C (2007) Why do women live longer than men? European Journal of Obstetrics &

Gynecology and Reproductive Biology 133: 126-133.

  • 7. Regan JC, Partridge L (2013) Gender and longevity: why do men die earlier than women?

Comparative and experimental evidence. Best Practice & Research Clinical Endocrinology & Metabolism 27: 467-479.

  • 8. Malmusi D, Artazcoz L, Benach J, Borrell C (2012) Perception or real illness? How chronic

conditions contribute to gender inequalities in self-rated health. The European Journal of Public Health 22: 781-786.

  • 9. Gorman BK, Read JnG (2006) Gender disparities in adult health: an examination of three measures
  • f morbidity. Journal of health and social behavior 47: 95-110.
  • 10. McDonough P, Walters V (2001) Gender and health: reassessing patterns and explanations. Social

science & medicine 52: 547-559.

  • 11. Barreto SM, Giatti L, Kalache A (2004) Gender inequalities in health among older Brazilian adults.

Revista Panamericana de Salud Pública 16: 110-117.

  • 12. Prus SG, Gee E (2003) Gender differences in the influence of economic, lifestyle, and psychosocial

factors on later-life health. Canadian Journal of Public Health/Revue Canadienne de Sante'e Publique: 306-309.

  • 13. Rueda S, Artazcoz L (2009) Gender inequality in health among elderly people in a combined

framework of socioeconomic position, family characteristics and social support. Ageing and society 29: 625-647.

  • 14. Arber S, Ginn J (1993) Gender and inequalities in health in later life. Social science & medicine 36:

33-46.

  • 15. Dalstra JAA, Kunst AE, Mackenbach JP (2006) A comparative appraisal of the relationship of

education, income and housing tenure with less than good health among the elderly in

  • Europe. Social Science & Medicine 62: 2046-2060.
  • 16. Grundy E, Holt G (2001) The socioeconomic status of older adults: How should we measure it in

studies of health inequalities? Journal of Epidemiology and Community Health 55: 895-904.

  • 17. Huisman M, Kunst AE, Mackenbach JP (2003) Socioeconomic inequalities in morbidity among the

elderly; a European overview. Social Science & Medicine 57: 861-873.

  • 18. Kan MY, Sullivan O, Gershuny J (2011) Gender convergence in domestic work: Discerning the

effects of interactional and institutional barriers from large-scale data. Sociology 45: 234-251.

  • 19. Coltrane S (2000) Research on household labor: Modeling and measuring the social

embeddedness of routine family work. Journal of Marriage and family 62: 1208-1233.

  • 20. Hook Jennifer L (2010) Gender Inequality in the Welfare State: Sex Segregation in Housework,

1965–2003. American Journal of Sociology 115: 1480-1523.

  • 21. Henderson KA (2014) Promoting health and well-being through leisure: Introduction to the

special issue. World Leisure Journal 56: 96-98.

  • 22. Anxo D, Flood L, Mencarini L, Pailhé A, Solaz A, et al. (2007) Time allocation between work and

family over the life-cycle: a comparative gender analysis of Italy, France, Sweden and the United States.

  • 23. Gershuny J, Sullivan O (2003) Time use, gender, and public policy regimes. Social Politics:

International Studies in Gender, State & Society 10: 205-228.

slide-11
SLIDE 11

11

  • 24. Eikemo TA, Bambra C, Judge K, Ringdal K (2008) Welfare state regimes and differences in self-

perceived health in Europe: a multilevel analysis. Social science & medicine 66: 2281-2295.

  • 25. Gove WR (1978) Sex differences in mental illness among adult women and men: An evaluation of

four questions raised regarding the evidence of higher rates in women. Social science & medicine 12: 187-198.

  • 26. Nathanson CA (1980) Social roles and health status among women: the significance of
  • employment. Social Science & Medicine Medical Psychology & Medical Sociology 14A: 463-

471.

  • 27. Sachs-Ericsson N, Ciarlo JA (2000) Gender, Social Roles, and Mental Health: An Epidemiological
  • Perspective. Sex Roles 43: 605-628.
  • 28. Adelmann PK (1994) Multiple Roles and Physical Health among Older Adults Gender and Ethnic
  • Comparisons. Research on Aging 16: 142-166.
  • 29. Glaser K, Evandrou M, Tomassini C (2005) The health consequences of multiple roles at older

ages in the UK. Health & Social Care in the Community 13: 470-477.

  • 30. Bird CE, Fremont AM (1991) Gender, Time Use, and Health. Journal of Health and Social Behavior

32: 114-129.

  • 31. Gimenez-Nadal JI, Molina JA (2015) Health status and the allocation of time: Cross-country

evidence from Europe. Economic Modelling 46: 188-203.

  • 32. Gimenez-Nadal JI, Ortega-Lapiedra R (2013) Health status and time allocation in Spain. Applied

Economics Letters 20: 1435-1439.

  • 33. Podor M, Halliday TJ (2012) Health status and the allocation of time. Health Economics 21: 514-

527.

  • 34. Fisher K, Gershuny J, Gauthier A (2012) Multinational time use study–User’s guide and

documentation.

  • 35. Eurofound (2012) Income from work after retirement in the EU. Publications Office of the

European Union,Luxembourg.

  • 36. Manor O, Matthews S, Power C (2000) Dichotomous or categorical response? Analysing self-rated

health and lifetime social class. International Journal of Epidemiology 29: 149-157.

  • 37. Idler EL, Benyamini Y (1997) Self-Rated Health and Mortality: A Review of Twenty-Seven

Community Studies. Journal of Health and Social Behavior 38: 21-37.

  • 38. Schnittker J, Bacak V (2014) The increasing predictive validity of self-rated health. PloS one 9:

e84933.

  • 39. Yun M-S (2004) Decomposing differences in the first moment. Economics letters 82: 275-280.
  • 40. Zhang H, d’Uva TB, van Doorslaer E (2015) The gender health gap in China: A decomposition
  • analysis. Economics & Human Biology 18: 13-26.
  • 41. Williams JAS (2009) Using non-linear decomposition to explain the discriminatory effects of

male–female differentials in access to care: a cardiac rehabilitation case study. Social science & medicine 69: 1072-1079.

  • 42. Tubeuf S, Jusot F (2011) Social health inequalities among older Europeans: the contribution of

social and family background. The European Journal of Health Economics 12: 61-77.

  • 43. StataCorp (2015) Stata 14 Base Reference Manual. College Station, TX: Stata Press.
  • 44. Bambra C, Pope D, Swami V, Stanistreet D, Roskam A, et al. (2009) Gender, health inequalities

and welfare state regimes: a cross-national study of 13 European countries. Journal of Epidemiology and Community Health 63: 38-44.

slide-12
SLIDE 12

12

Table 1. Multivariate Associations between Poor Self-reported Health Status, Time Use, Socio-economic position and Family Characteristics, pooled data of 5 Countries. Men and women 65+ years old. Variables Model 1 Model 2 Model 3

aOR (95% CI) aOR (95% CI) aOR (95% CI)

Time use Activity

Paid work hours/day

Less than 1 ( ref) 1or more

0.38 (0.34 - 0.44)*** 1.00 (0.84 - 1.19) 0.75 (0.63 - 0.90)*** House work hours/day

Less than 4 (ref) 4 to 6

0.93 (0.87 - 0.99)** 0.86 (0.81 - 0.92)*** 0.76 (0.71 - 0.81)***

>6

0.92 (0.86 - 1.00)** 0.83 (0.76 - 0.90)*** 0.65 (0.60 - 0.71)*** Active leisure hours/day

Less than 2 (ref) 2 to 4

0.82 (0.77 - 0.87)*** 0.86 (0.81 - 0.92)*** 0.75 (0.70 - 0.81)***

>4

0.57 (0.53 - 0.61)*** 0.66 (0.61 - 0.71)*** 0.53 (0.49 - 0.58)*** Passive leisure hours/day

Less than 3 (ref) 3 to 5

1.24 (1.17 - 1.32)*** 1.16 (1.09 - 1.23)*** 1.14 (1.07 - 1.21)***

>5

1.38 (1.28 - 1.48)*** 1.24 (1.15 - 1.34)*** 1.31 (1.21 - 1.42)*** Personal activity hours/day

Less than 10 (ref) 10 to 12

1.54 (1.43 - 1.66)*** 1.29 (1.19 - 1.39)*** 1.01 (0.94 - 1.10)

>12

2.84 (2.62 - 3.07)*** 2.05 (1.89 - 2.23)*** 1.43 (1.31 - 1.56)***

Sex

Men (ref) Women

1.20 (1.14 - 1.27)*** 1.32 (1.25 - 1.40)***

Age

65-69 ( ref) 70-74

1.14 (1.07 - 1.22)*** 1.15 (1.08 - 1.23)***

75-79

1.35 (1.26 - 1.45)*** 1.41 (1.31 - 1.52)***

80+

1.32 (1.23 - 1.42)*** 1.44 (1.33 - 1.55)***

Education

Incomplete Sec. or less (ref) Secondary completed

0.47 (0.45 - 0.50)*** 0.58 (0.54 - 0.61)***

Tertiary completed or above

0.27 (0.25 - 0.29)*** 0.47 (0.43 - 0.51)***

Wealth

Land tenure Renting (ref)

Owner occupier

0.81 (0.76 - 0.86)*** 0.80 (0.75 - 0.86)***

Employment Status

Not working for pay (ref) Currently in paid employment

0.42 (0.37 - 0.48)*** 0.52 (0.45 - 0.59)***

Household size

1 member (ref)

2 members

1.18 (1.11 - 1.26)*** 1.03 (0.97 - 1.10)

3+ members

1.34 (1.24 - 1.44)*** 1.03 (0.95 - 1.11)

Welfare States (countries)

Germany (ref)

Italy

2.85 (2.59 - 3.14)***

Spain

1.19 (1.09 - 1.31)***

United Kingdom

0.68 (0.61 - 0.76)***

United States

0.47 (0.43 - 0.52)***

Observations

31,425 31,425 31,425

Pseudo R2

0.0521 0.107 0.1520

Log Likelihood

  • 20263.22
  • 19090.029
  • 18128.073

Notes: aOR- adjusted Odd Ratio, *** p<0.01, ** p<0.05, * p<0.1. Regression include day-of-week dummies.

slide-13
SLIDE 13

13

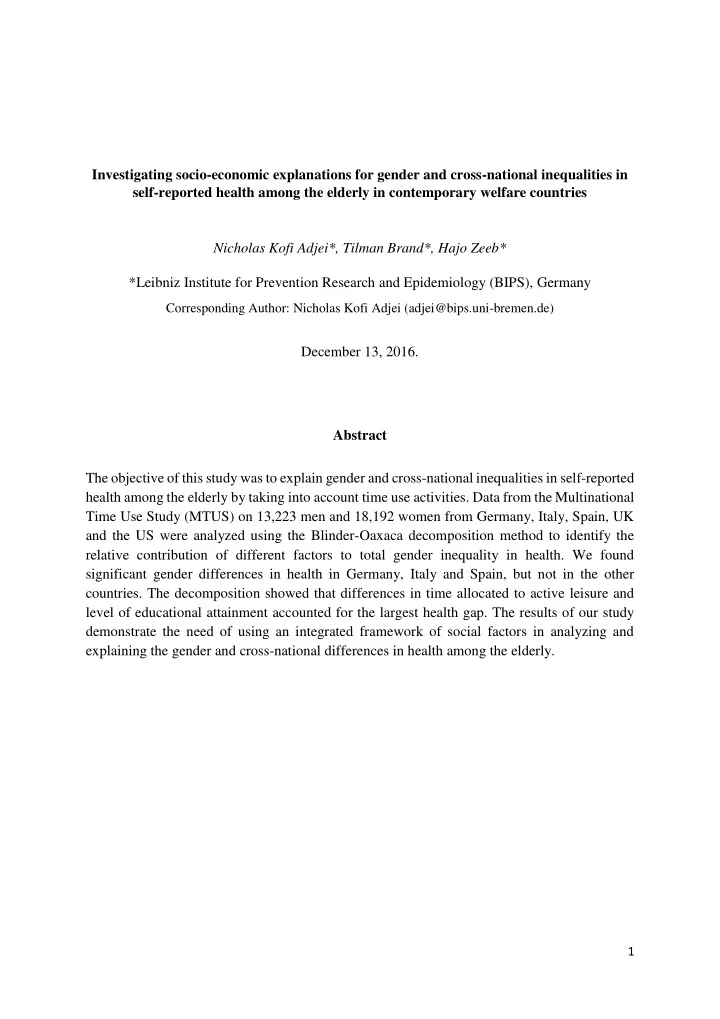
Table 2. Non-linear Decomposition of female excess in the probability of reporting poor health, by country

Inequality contributions in terms of differences in group characteristics (by variables) & group processes Germany Italy Spain UK* USA* Absolute (95% CI) Percent Absolute (95% CI) Percent Absolute (95% CI) Percent Absolute (95% CI) Absolute (95% CI) Predicted mean in women 0.532 (0.510 – 0.555) 0.831 (0.820 – 0.841) 0.674 (0.662 – 0.686) 0.470 (0.447 – 0.494) 0.318 (0.304 – 0.332) Predicted mean in men 0.392 (0.368 – 0.417) 0.734 (0.720 – 0.749) 0.585 (0.570 – 0.599) 0.471 (0.444 – 0.498) 0.326 (0.307 – 0.344) Female excess 0.140 (0.106 – 0.174) 0.096 (0.079 – 0.114) 0.089 (0.070 – 0.108)

  • 0.000 (-0.036 – 0.036)
  • 0.008 (-0.031 – 0.016)

Age 0.003 (0.001 – 0.006) 2.30% 0.011 (0.008 – 0.014) 11.10% 0.003 (0.001 – 0.004) 2.80% 0.003 (-0.001 – 0.007) 0.000 (-0.001 – 0.001) Education 0.016 (0.005 – 0.028) 11.50% 0.010 (0.007 – 0.013) 10.10% 0.016 (0.012 – 0.019) 17.50% 0.002 (-0.004 – 0.009) 0.003 (-0.004 – 0.010) Land tenure 0.010 (0.000 – 0.021) 7.50% 0.013 (0.009 – 0.017) 13.40% 0.009 (0.006 – 0.013) 10.50% 0.026 (0.003 – 0.049) 0.002 (-0.002 – 0.005) Car 0.005 (0.001 – 0.009) 3.40% 0.001 (-0.001 – 0.002) 0.80% 0.000 (-0.001 – 0.001) 0.20% 0.003 (-0.001 – 0.008)

  • Employment status

0.010 (0.004 – 0.016) 7.20% 0.006 (0.002 – 0.009) 5.80% 0.002 (-0.000 – 0.004) 2.10% 0.006 (-0.002 – 0.013) 0.007 (-0.006 – 0.020) Household Size

  • 0.021 (-0.031 - -0.010)
  • 14.70%

0.001 (-0.004 – 0.005) 0.80%

  • 0.001 (-0.005 – 0.003)
  • 1.00%
  • 0.024 (-0.042 - -0.007)
  • 0.001 (-0.003 – 0.001)

Paidwork 0.009 (0.001 – 0.017) 6.70% 0.001 (-0.006 – 0.007) 0.60% 0.001 (-0.003 – 0.004) 0.80% 0.003 (-0.002 – 0.008) 0.001 (-0.002 – 0.004) Housework

  • 0.009 (-0.026 – 0.009)
  • 6.10%
  • 0.000 (-0.045 – 0.044)
  • 0.50%

0.002 (-0.040 – 0.044) 2.20%

  • 0.022 (-0.038 - -0.006)
  • 0.007 (-0.020 – 0.005)

Active leisure 0.013 (0.004 – 0.022) 9.10% 0.013 (-0.011 – 0.037) 13.40% 0.017 (-0.007 – 0.041) 18.80% 0.007 (-0.001 – 0.015)

  • 0.002 (-0.005 – 0.001)

Passive leisure

  • 0.000 (-0.005 – 0.004)
  • 0.20%
  • 0.006 (-0.016 – 0.005)
  • 5.80%
  • 0.007 (-0.014 – 0.001)
  • 7.30%
  • 0.007 (-0.013 - -0.001)
  • 0.002 (-0.007 – 0.003)

Personal activity 0.000 (-0.001 – 0.002) 0.30%

  • 0.003 (-0.007 – 0.002)
  • 2.60%
  • 0.015 (-0.023 - -0.007)
  • 17.00%

0.000 (-0.001 – 0.001) 0.002 (-0.002 – 0.006) Contribution to that part of inequality due differences in group characteristics (Endowment effects) 0.038 (0.020 – 0.056) 27.00% 0.045 (0.035 – 0.056) 47.20% 0.026 (0.016 – 0.037) 29.70%

  • 0.003 (-0.019 – 0.013)

0.003 (-0.007 – 0.014) Contribution to that part of inequality due differences in group processes (Coefficient effects) 0.102 (0.073 – 0.131) 73.00% 0.051 (0.037 – 0.065) 52.80% 0.063 (0.047 – 0.079) 70.30% 0.003 (-0.029 – 0.035)

  • 0.011 (-0.032 – 0.010)

Notes: * - No female excess in the probability of reporting poor health. CI: 95 percent confidence interval.

slide-14
SLIDE 14

14

Appendix

Table S1. Typology of activities Broad categories of activity Name of variable (harmonised) Description

  • 1. Paid work

AV01 Paid work Av02 Paid work at home AV03 Second job AV05 Travel to/ from work 2.Housework AV06 Cooking/Washing up AV07 Housework AV08 Odd jobs AV09 Gardening, pets AV10 Shopping AV12 Domestic travel 3.Active leisure AV11 Child care AV23 Civic duties AV19 Active sport AV21 Walks AV17 Leisure travel AV18 Excursions AV22 Religious activities AV24 Cinema, theatre AV26 Social club AV27 Pub AV28 Restaurant AV29 Visiting friends AV04 School/classes AV20 Passive/observer sports AV33 Study AV34 Reading books AV35 Reading papers and magazines AV37 Conversation AV38 Entertaining friends AV39 Knitting sewing etc. AV40 Other hobbies 4.Passive leisure AV30 Listening to radio AV31 Television, video AV32 Listening to tapes etc. AV36 Relaxing 5.Personal activity AV13 Dressing/toilet AV14 Personal Services AV15 Meals, snacks AV16 Sleep